The post TRUMP Coin in Trouble? $23M Whale Move Hints at Sell-Off as Price Faces Breakdown Risk appeared first on Coinpedia Fintech News A sudden $23 million onThe post TRUMP Coin in Trouble? $23M Whale Move Hints at Sell-Off as Price Faces Breakdown Risk appeared first on Coinpedia Fintech News A sudden $23 million on

TRUMP Coin in Trouble? $23M Whale Move Hints at Sell-Off as Price Faces Breakdown Risk

2026/03/26 15:33
3 min read
For feedback or concerns regarding this content, please contact us at crypto.news@mexc.com
Whales Are Accumulating TRUMP as Price Soars 30% Here’s What Data Shows

The post TRUMP Coin in Trouble? $23M Whale Move Hints at Sell-Off as Price Faces Breakdown Risk appeared first on Coinpedia Fintech News

A sudden $23 million on-chain transfer has put the Official TRUMP memecoin ($TRUMP) back under the spotlight, but this time, for the wrong reasons.

The move, traced to wallets linked with internal allocations, comes at a moment when price is already struggling below critical resistance. Historically, such transfers have often preceded exchange inflows and sharp volatility spikes, raising concerns of a potential sell-off. 

With price structure weakening and whale activity surging, the market now faces a crucial question. Is the TRUMP coin preparing for a breakdown, or is this a calculated shakeout before the next rally?

Whale Movement Triggers Market Speculation

On-chain data reveals that approximately $23 million worth of $TRUMP tokens was moved from a team-associated wallet into a fresh address, a pattern that typically signals preparation for redistribution. While no direct exchange inflow has been confirmed yet, the market rarely waits for confirmation in such cases. Historically, similar high-value transfers have led to increased circulating supply once tokens hit exchanges, often triggering short-term price pressure. The timing of this move, combined with an already fragile technical setup, has amplified bearish expectations across the market.

At the same time, whale metrics paint a more complex picture. The number of large holders has climbed to a multi-month high, suggesting that accumulation may be quietly taking place. This divergence, where potential distribution meets rising accumulation, creates a high-stakes environment, often leading to sharp and unpredictable price swings.

TRUMP Coin Price Retest Support Zone: Rebound or Breakdown?

The TRUMP coin is showing clear signs of weakness. The asset continues to trade within a descending structure, marked by consistent lower highs, a classic indication of bearish control. The most critical level remains the $3.80 to $4.00 resistance zone, where price has faced repeated rejection. Each failed breakout attempt has strengthened this zone as a supply barrier, with sellers aggressively defending higher levels. As a result, bullish momentum has been unable to sustain, keeping the broader trend under pressure.

Trump coin price chart

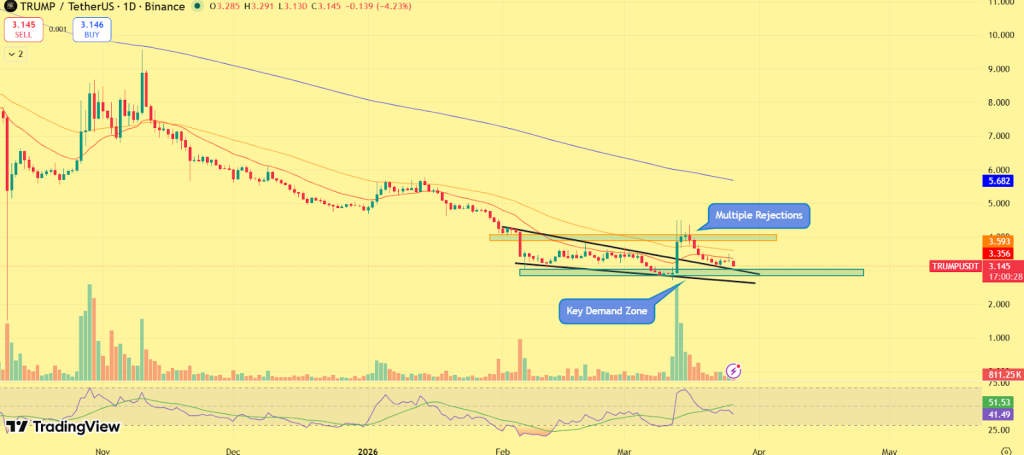
Currently, the TRUMP coin price is hovering near the $3.10 support level, a zone that has provided temporary stability. However, the absence of strong buying continuation suggests that demand remains weak. Volume patterns further indicate that recent moves may be driven more by distribution than accumulation, reinforcing the cautious outlook.

Key Levels to Watch

The immediate structure places strong emphasis on the $3.00–$3.10 support zone, which now acts as a critical line of defense. A breakdown below this level could accelerate downside momentum, potentially pushing price toward the $2.60–$2.80 demand zone, where stronger buyer interest may emerge. On the upside, recovery depends on reclaiming the $3.50–$3.60 region, which would signal short-term strength returning. However, a full bullish shift would require a decisive breakout above the $3.80 resistance, a level that has consistently capped upside attempts.

Market Opportunity
OFFICIAL TRUMP Logo
OFFICIAL TRUMP Price(TRUMP)
$3.127
$3.127$3.127
-5.72%
USD
OFFICIAL TRUMP (TRUMP) Live Price Chart
Disclaimer: The articles reposted on this site are sourced from public platforms and are provided for informational purposes only. They do not necessarily reflect the views of MEXC. All rights remain with the original authors. If you believe any content infringes on third-party rights, please contact crypto.news@mexc.com for removal. MEXC makes no guarantees regarding the accuracy, completeness, or timeliness of the content and is not responsible for any actions taken based on the information provided. The content does not constitute financial, legal, or other professional advice, nor should it be considered a recommendation or endorsement by MEXC.

You May Also Like

Pi Network Price News Today; Cardano Price Predictions & Everything To Know About This Trending PayFi Altcoin

Pi Network Price News Today; Cardano Price Predictions & Everything To Know About This Trending PayFi Altcoin

Pi Network price is currently $0.3545 and the altcoin is approaching a crucial moment with the TOKEN2049 event in Singapore on October 1–2. Investors are hoping for clear guidance that could drive Pi Coin back toward the $1 mark. Meanwhile, Cardano continues to face resistance near $0.90, and Remittix (RTX) is gaining momentum as a […] The post Pi Network Price News Today; Cardano Price Predictions & Everything To Know About This Trending PayFi Altcoin appeared first on Live Bitcoin News.
Share
LiveBitcoinNews2025/09/18 21:30
Likely to trade in a range of 146.30/147.35 – UOB Group

Likely to trade in a range of 146.30/147.35 – UOB Group

The post Likely to trade in a range of 146.30/147.35 – UOB Group appeared on BitcoinEthereumNews.com. US Dollar (USD) is likely to trade in a range of 146.30/147.35. In the longer run, downward momentum has slowed, but there is a slim chance for USD to revisit the 145.45 level, UOB Group’s FX analysts Quek Ser Leang and Peter Chia note. Downward momentum has slowed 24-HOUR VIEW: “Yesterday, when USD was at 146.35, we indicated that ‘strong downward momentum may lead to further USD weakness, possibly toward 145.85.’ We highlighted that ‘to sustain the downward momentum, USD must not break above 146.90, with minor resistance at 146.60.’ We did not anticipate the volatile price movements, as USD plunged to a low of 145.47 and then snapped back, reaching a high of 147.05. While there has been a build-up in upward momentum, this is likely to lead to a higher range of 146.30/147.35. In other words, USD is unlikely to break clearly above 147.35.” 1-3 WEEKS VIEW: “Yesterday (17 Aug, spot at 146.35), we revised our USD outlook to negative, indicating that ‘the sharp increase in short-term downward momentum suggests USD could weaken to 145.85.’ We did not anticipate the sharp drop that sent USD to a low of 145.47. USD rebounded strongly from the low to close on a firm note at 146.97 (+0.33%). While downward momentum has slowed with the strong rebound, only a breach of 147.35 (no change in ‘strong resistance’ level) would indicate that USD has moved back into a range-trading phase. Until then, there is a slim chance for USD to revisit the 145.45 level.” Source: https://www.fxstreet.com/news/usd-jpy-likely-to-trade-in-a-range-of-14630-14735-uob-group-202509181101
Share
BitcoinEthereumNews2025/09/18 23:02
XRP USD Price Outlook: Ripple Fails to Breach $1.60, What Next?

XRP USD Price Outlook: Ripple Fails to Breach $1.60, What Next?

The post XRP USD Price Outlook: Ripple Fails to Breach $1.60, What Next? appeared on BitcoinEthereumNews.com. XRP USD is clinging to a narrow ledge. The token trades
Share
BitcoinEthereumNews2026/03/26 17:09