Silver Price Surges as US Dollar Stumbles, Yet Volatile Outlook Looms
BitcoinWorld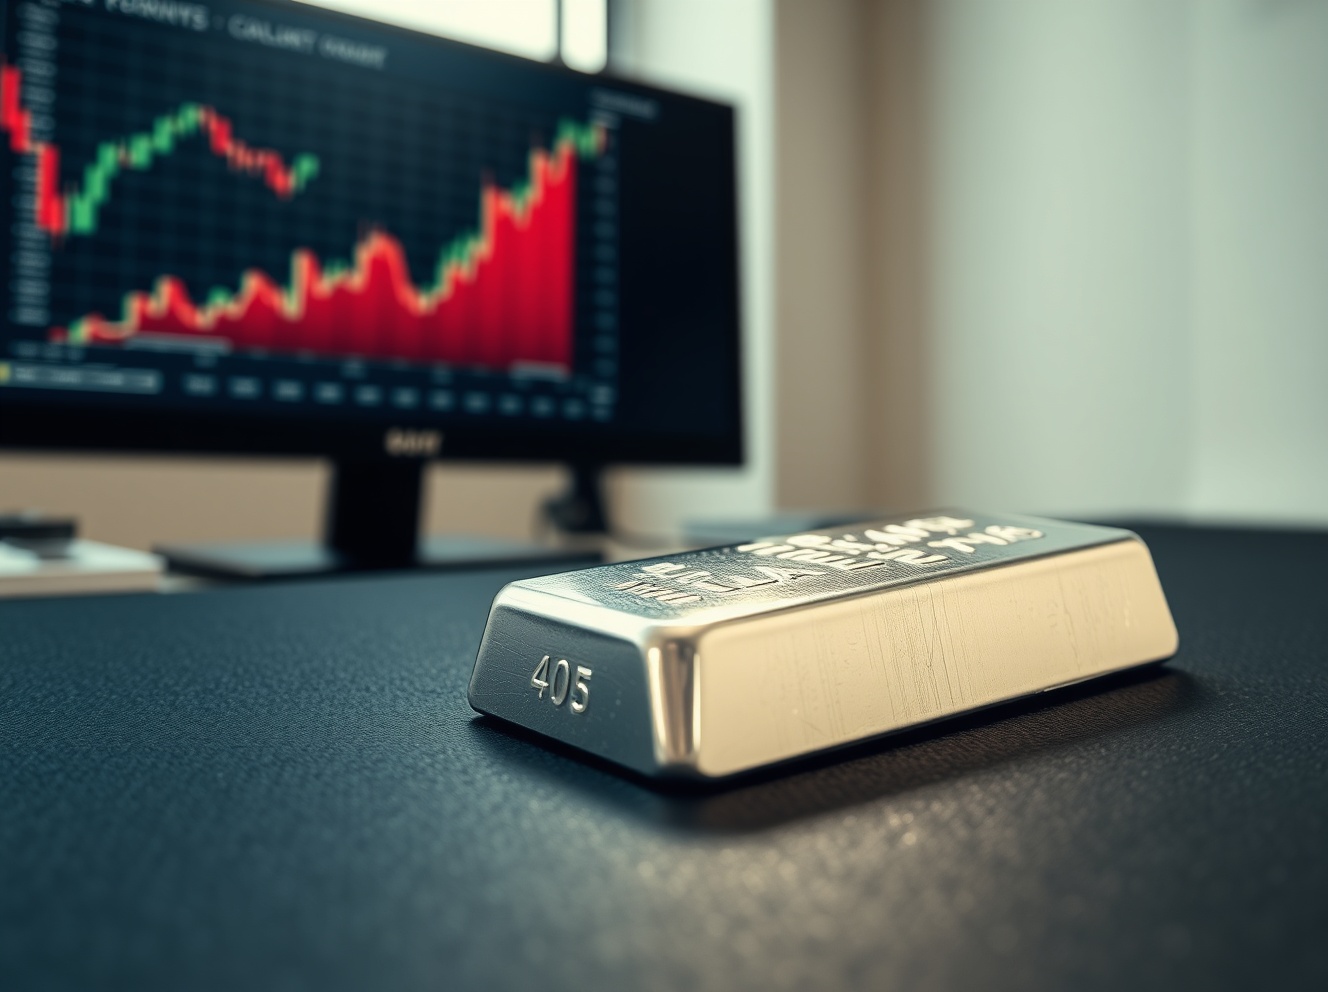
Silver Price Surges as US Dollar Stumbles, Yet Volatile Outlook Looms
NEW YORK, March 2025 – The silver price reversed early losses to trade firmly positive on Wednesday, as the US Dollar Index surrendered its morning advance, injecting fresh volatility into precious metals markets. Consequently, traders now scrutinize technical charts and macroeconomic signals for direction. This price action underscores the metal’s sensitive relationship with currency movements and broader financial uncertainty.
Silver Price Technical Analysis and Chart Patterns
Market analysts immediately turned to daily and weekly charts following the session’s reversal. The intraday bounce established a solid support level near the 50-day moving average. Moreover, the relative strength index (RSI) exited oversold territory, signaling a potential shift in short-term momentum. Key resistance now sits at the recent swing high, a breach of which could invite further buying. Importantly, trading volume spiked during the rally, confirming participant conviction.
Several chart formations warrant attention. A bullish engulfing candle appeared on the four-hour chart, coinciding perfectly with the dollar’s peak. Additionally, the moving average convergence divergence (MACD) histogram shows decelerating downward momentum. However, the primary trend on the monthly chart remains contested, requiring sustained price action above a critical Fibonacci level. Therefore, chartists advocate for cautious optimism pending a clearer breakout.
The US Dollar’s Pivotal Role in Commodity Markets
The US Dollar Index (DXY) serves as a critical counterweight for dollar-denominated assets like silver. Initially bolstered by hawkish Federal Reserve commentary, the dollar’s strength faded amid mixed economic data. Specifically, softer-than-expected manufacturing figures pressured the currency, directly benefiting precious metals. Historically, a weaker dollar makes commodities cheaper for holders of other currencies, boosting demand.
This inverse correlation remains a cornerstone of commodity trading. For instance, a 1% decline in the DXY frequently corresponds with a 1.5% to 3% gain in silver, all else being equal. The dollar’s retreat from its session high provided the fundamental catalyst for silver’s afternoon surge. Furthermore, shifting expectations for future interest rate paths continue to drive currency volatility, creating ripple effects across metal markets.
Expert Insight on Macroeconomic Drivers
Dr. Anya Sharma, Chief Commodity Strategist at Global Markets Insight, provided context. “Silver operates in a dual paradigm,” she explained. “It reacts to its monetary heritage during currency swings and to its industrial demand profile during growth cycles. The current environment blends both, leading to heightened volatility.” Sharma references data from the Silver Institute showing robust photovoltaic demand, which provides a structural price floor.
Recent geopolitical tensions have also influenced market sentiment. Central bank diversification efforts, documented in World Gold Council reports, increasingly include silver. This institutional demand introduces a new, less price-sensitive buyer into the market. Consequently, traditional technical patterns now interact with these fundamental shifts, complicating short-term forecasts.
Comparative Performance: Silver Versus Other Assets
Silver’s performance must be evaluated relative to other havens and commodities. While gold also gained, silver’s advance was more pronounced, narrowing the gold-to-silver ratio. This ratio, watched closely by metals traders, suggests market participants may be favoring silver’s industrial upside potential. Conversely, copper prices exhibited muted movement, indicating the move was not broad-based across industrial metals.
| Asset | Performance | Key Driver |
|---|---|---|
| Silver (XAG/USD) | +2.1% | USD Weakness, Technical Rebound |
| Gold (XAU/USD) | +0.8% | Safe-Haven Demand |
| US Dollar Index (DXY) | -0.5% | Mixed Economic Data |
| S&P 500 Index | Flat | Sector Rotation |
The table illustrates silver’s outperformance. This divergence highlights its unique sensitivity. Several factors contribute to this volatility profile:
- Higher Beta: Silver typically exhibits greater price volatility than gold.
- Industrial Component: Over 50% of demand stems from industrial applications, linking it to economic cycles.
- Smaller Market: The physical market’s smaller size can amplify price moves during shifts in investment flows.
Market Outlook and Key Risk Factors
The outlook for silver remains uncertain, balanced between opposing forces. On the supportive side, persistent geopolitical friction and central bank buying provide a bid. Additionally, the global transition to green energy underpins long-term demand for silver in solar panels and electronics. However, significant headwinds persist, primarily from the monetary policy landscape.
Forecasts from major investment banks reflect this dichotomy. Some project moderate gains, citing supply constraints and sustained investment demand. Others warn of near-term pressure if the Federal Reserve maintains a restrictive stance for longer than currently priced. The path of real interest rates—nominal rates minus inflation—will likely be the ultimate arbiter. Elevated real rates increase the opportunity cost of holding non-yielding assets like silver.
The Inflation and Real Rate Dynamic
Market participants closely monitor inflation expectations. While silver is traditionally an inflation hedge, its effectiveness depends on the inflation source and the accompanying policy response. Demand-pull inflation from strong growth can benefit silver’s industrial side. Conversely, cost-push inflation that triggers aggressive central bank tightening can be negative. Current data suggests markets are grappling with this exact puzzle, leading to choppy, range-bound trading.
Conclusion
The silver price reversal, fueled by a retreating US dollar, highlights the metal’s acute sensitivity to foreign exchange dynamics and technical levels. While charts suggest a near-term bullish bias, the fundamental outlook is clouded by uncertainty around monetary policy and global growth. Traders should prepare for continued volatility, using key support and resistance levels from chart analysis as guides. Ultimately, silver’s dual nature as both monetary metal and industrial commodity ensures it will remain at the crossroads of major macroeconomic trends.
FAQs
Q1: Why does the US dollar’s value affect the silver price?
The silver market uses US dollars for global pricing. Therefore, a weaker dollar makes silver cheaper for buyers using euros, yen, or other currencies, which can increase demand and push the price higher. Conversely, a stronger dollar makes it more expensive, potentially dampening demand.
Q2: What are the main uses driving demand for silver?
Demand is split between industrial and investment uses. Industrial applications, which account for over half of demand, include electronics, solar panels, and automotive components. Investment demand covers physical bars, coins, and exchange-traded funds (ETFs).
Q3: What is the gold-to-silver ratio, and why is it important?
This ratio measures how many ounces of silver it takes to buy one ounce of gold. Traders use it to gauge the relative valuation of the two metals. A high ratio may suggest silver is undervalued relative to gold, while a low ratio may indicate the opposite.
Q4: How do interest rates impact silver prices?
Silver pays no interest or dividend. When interest rates rise, the opportunity cost of holding silver increases because investors could earn yield elsewhere. Higher real interest rates (adjusted for inflation) are typically a headwind for non-yielding precious metals.
Q5: What key chart levels do traders watch for silver?
Traders monitor moving averages (like the 50-day and 200-day), Fibonacci retracement levels from major swings, and previous areas of support and resistance. High volume at certain price points also indicates significant market interest and can define important technical levels.
This post Silver Price Surges as US Dollar Stumbles, Yet Volatile Outlook Looms first appeared on BitcoinWorld.
You May Also Like

Siren Token Sheds 70% as Analysts Question Supply Structure
Record instroom Bitcoin-ETF’s – richting $120.000?