

Aster (ASTER) Price Breakout Fails After 35-Day Consolidation – What Happens Next?
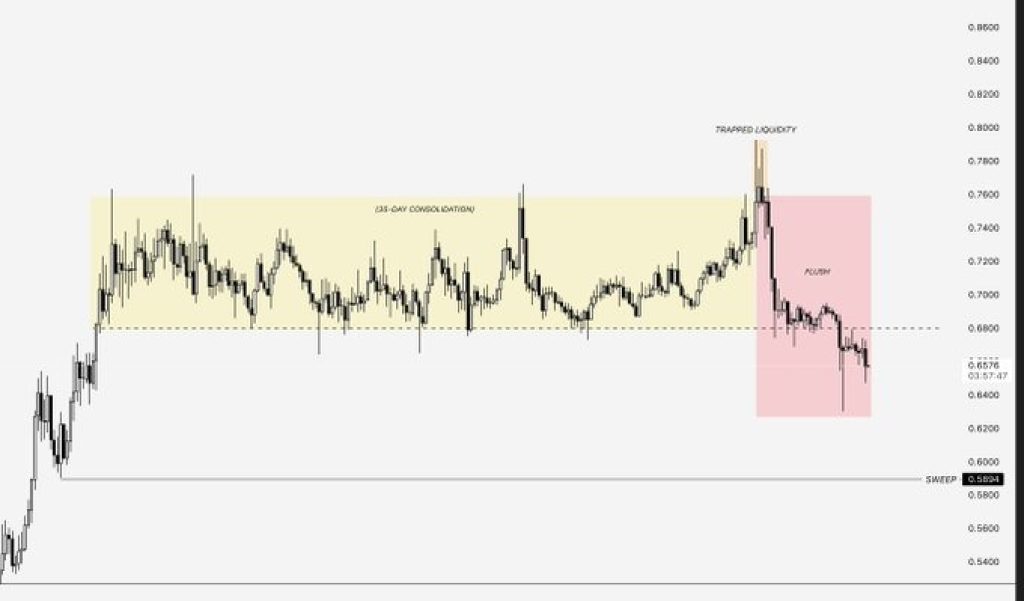
Aster (ASTER) has been consolidating for more than a month, fluctuating within a price range that technical traders call a consolidation range. For 35 days, the price of ASTER has been fluctuating between a definite support price and resistance price without making a significant move either way.
This kind of structure usually builds pressure. When a chart just sits in one place for that long, it stops being “just a range.” It turns into a line in the sand.
Every bounce off the top and every reaction at the bottom adds weight to it. Traders start treating those levels like they matter, because they usually do.
And once one side finally breaks, the move rarely stays calm. That’s what we’re seeing here.
The ASTER price did try to push out of that range. For a moment, it looked like it might actually go somewhere. Price started lifting, buyers stepped in, and it felt like the breakout might hold. This likely attracted buyers expecting a continuation upward.
However, the breakout didn’t hold. Instead, the price reversed quickly and fell back into the range. This is called a failed breakout, which typically indicates weakness rather than strength in a stock.
From there, things started to shift more clearly in favor of sellers.
 Source: X/Ardi
Loss of Support Changes the Structure for ASTER
The key moment came when the ASTER price lost the lower boundary of the range, around the $0.68 level. This level had acted as support multiple times during the consolidation phase, so breaking below it changed the overall structure.
Once that support gave way, the price moved lower with more speed. The chart highlights this as a “flush,” where selling pressure increases and trapped buyers begin to exit their positions.
As noted in the analysis, losing $0.68 opened the path toward $0.60. Price has already moved close to that region, meaning the bearish scenario is no longer just a possibility, it is already playing out.
Read Also: Why This Analyst Says Dump US Stocks and Load Up on Gold Miners Now
What Happens Next for ASTER?
At this point, the main focus is to determine whether the ASTER price will be able to recover the lost price. This is because if the price is able to recover above $0.68, there is a possibility of getting some stability again.
However, if the price can’t claw its way back above $0.68, the slide could pick up speed. It might sink toward $0.60, or even dip lower. Right now, the market feels the squeeze, and every move counts.
Subscribe to our YouTube channel for daily crypto updates, market insights, and expert analysis.
The post Aster (ASTER) Price Breakout Fails After 35-Day Consolidation – What Happens Next? appeared first on CaptainAltcoin.


You May Also Like

Best Music AI Websites For Songs And Soundtracks

EUR/GBP Exchange Rate Surges as Bank of England Rate Hike Expectations Intensify – Market Analysis


