On-chain data from CryptoQuant shows Bitcoin and Ethereum leaving major exchanges at an accelerating pace while U.S. spot ETFs added 45,700 BTC worth approximatelyOn-chain data from CryptoQuant shows Bitcoin and Ethereum leaving major exchanges at an accelerating pace while U.S. spot ETFs added 45,700 BTC worth approximately

$5.4 Billion Left Binance and Bitfinex While ETFs Absorbed 45,700 BTC – The Supply and Demand Split Is Widening

2026/03/20 02:22
5 min read
For feedback or concerns regarding this content, please contact us at crypto.news@mexc.com

On-chain data from CryptoQuant shows Bitcoin and Ethereum leaving major exchanges at an accelerating pace while U.S. spot ETFs added 45,700 BTC worth approximately $3.25 billion between February 24 and March 19, creating a structural divergence between where supply is going and where institutional demand is coming from.

What the Binance Cumulative Netflow Chart Shows

The first chart covers November 2024 through March 19, 2026, tracking cumulative BTC and ETH netflows on Binance in dollar value. The BTC flow in orange and ETH flow in purple both sit below the zero line for the majority of the visible period, indicating net outflows have been the dominant condition since late November.

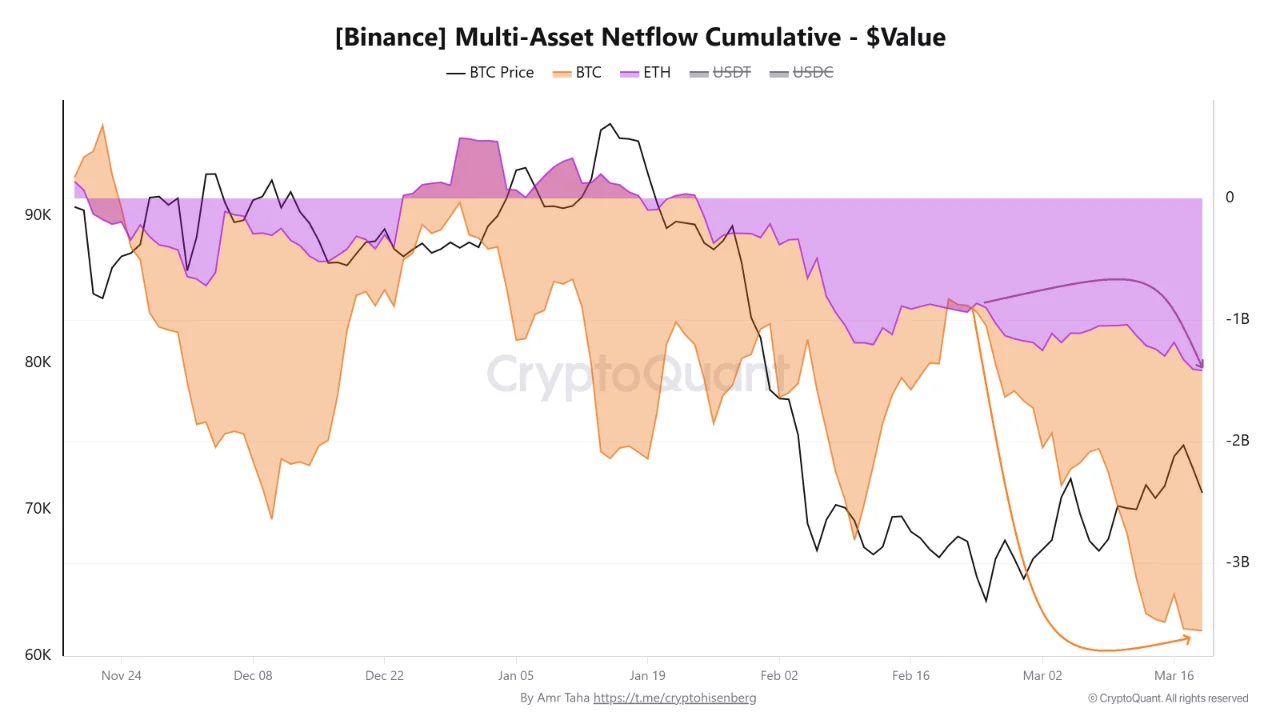
The BTC outflow trajectory accelerated sharply in February. Between February 21 and March 19, Bitcoin cumulative netflows on Binance shifted from approximately positive $55 million to negative $2.1 billion. That is a $2.155 billion swing in less than a month. The orange area on the chart drops steeply toward the lower right, reaching its deepest visible reading near March 16 before a slight recovery. The orange line at the very bottom right of the chart shows the most extreme cumulative outflow point of the entire tracked period.

Ethereum followed the same direction with less severity. Cumulative ETH netflows moved from negative $935 million to negative $1.4 billion over the same window, an additional $465 million in outflows. The purple ETH area maintains its negative position throughout the chart period but has not recovered meaningfully since February. Both assets accelerating outflows simultaneously points toward coordinated large-holder behavior rather than asset-specific selling pressure.

What the Exchange Netflow Chart Shows

The second chart tracks daily BTC netflows across eight major exchanges from January 19 through mid-March 2026, with Binance in orange, OKX in purple, Bybit in grey, Kraken in blue, Bitfinex in green, Coinbase in light grey, Gemini in teal, and HTX Global in dark blue, alongside the BTC price line in black.

The two dominant events on this chart are both green Bitfinex bars. Around March 4, a green outflow bar drops to approximately negative $1.75 billion, annotated with a triangle marker at the bottom of the chart. Around March 16, a second green bar drops to approximately negative $1.57 billion, also annotated. Both spikes dwarf every other exchange’s daily netflow reading across the entire chart period. No other exchange comes close to those magnitudes on any single day.

The Binance orange bars show smaller but consistent net outflow readings throughout the period. The other exchanges produce mixed daily signals that largely cancel each other out. Bitfinex is the single largest driver of the combined $3.32 billion outflow figure across the two-week window. Combined with the Binance cumulative figure, total outflows from the two exchanges exceed $5.4 billion across the period covered.

Neither spike produced a price breakdown at the time of occurrence. The March 4 event coincided with price near $65,000 on the black line. The March 16 event occurred as price was recovering toward $73,000. Supply leaving exchanges at scale during a price recovery is more consistent with institutional positioning than with panic selling.

Nasdaq Gets SEC Approval for Tokenized Equity Trading : U.S. Stocks Are Going On-Chain

What the ETF Accumulation Chart Shows

The third chart covers late September 2024 through March 16, 2026, tracking BTC price in black against total U.S. spot ETF holdings in yellow, measured in BTC on the right axis. The yellow ETF holdings line peaked near 1.35 million BTC around October 2024, declined through the price drawdown period from November through February, and has since recovered to approximately 1.29 million to 1.30 million BTC.

The annotated figure on the chart identifies 45,700 BTC added to total ETF holdings between February 24 and March 19, equivalent to approximately $3.25 billion at an average price near $71,000. That accumulation occurred across the same window when exchange outflows were accelerating, when Bitcoin was trading between $63,000 and $74,000, and when daily ETF flow data showed individual sessions of significant outflows from specific issuers including Fidelity and BlackRock.

The apparent contradiction between the daily outflow data and the cumulative ETF holdings increase resolves when both timeframes are considered together. Single-day outflows reflect rebalancing and short-term positioning. The 24-day cumulative figure reflects the net direction of institutional positioning across the full window. The net direction was accumulation.

What the Three Charts Together Indicate

The data describes a market where supply is being systematically removed from exchange liquidity while institutional demand is absorbing it through ETF custody channels. BTC and ETH leaving Binance is not hitting the market as selling pressure. Bitfinex outflows at $1.75 billion and $1.57 billion are not appearing as ask-side volume on price charts. The supply is moving to cold storage and ETF custody rather than to new sellers.

That dynamic does not automatically translate into price appreciation on a specific timeline. Supply moving off exchanges reduces the available float but does not force buyers into the market. What it does is change the conditions under which price discovery occurs. A market with a shrinking exchange float and $3.25 billion in institutional accumulation across 24 days is structurally different from one where supply is freely available.

Price is currently below $70,000 under geopolitical and macro pressure. The on-chain structure underneath that price level tells a different story than the near-term chart does.

The post $5.4 Billion Left Binance and Bitfinex While ETFs Absorbed 45,700 BTC – The Supply and Demand Split Is Widening appeared first on ETHNews.

Market Opportunity
Bitcoin Logo
Bitcoin Price(BTC)
$70,305.79
$70,305.79$70,305.79
+1.30%
USD
Bitcoin (BTC) Live Price Chart
Disclaimer: The articles reposted on this site are sourced from public platforms and are provided for informational purposes only. They do not necessarily reflect the views of MEXC. All rights remain with the original authors. If you believe any content infringes on third-party rights, please contact crypto.news@mexc.com for removal. MEXC makes no guarantees regarding the accuracy, completeness, or timeliness of the content and is not responsible for any actions taken based on the information provided. The content does not constitute financial, legal, or other professional advice, nor should it be considered a recommendation or endorsement by MEXC.

You May Also Like

Trump-backed WLFI  launches AgentPay SDK open-source payment toolkit for AI agents

Trump-backed WLFI  launches AgentPay SDK open-source payment toolkit for AI agents

The Trump family has expanded its presence in the crypto community with a major development for artificial intelligence (AI) agents. According to reports, World
Share
Cryptopolitan2026/03/20 19:03
Summarize Any Stock’s Earnings Call in Seconds Using FMP API

Summarize Any Stock’s Earnings Call in Seconds Using FMP API

Turn lengthy earnings call transcripts into one-page insights using the Financial Modeling Prep APIPhoto by Bich Tran Earnings calls are packed with insights. They tell you how a company performed, what management expects in the future, and what analysts are worried about. The challenge is that these transcripts often stretch across dozens of pages, making it tough to separate the key takeaways from the noise. With the right tools, you don’t need to spend hours reading every line. By combining the Financial Modeling Prep (FMP) API with Groq’s lightning-fast LLMs, you can transform any earnings call into a concise summary in seconds. The FMP API provides reliable access to complete transcripts, while Groq handles the heavy lifting of distilling them into clear, actionable highlights. In this article, we’ll build a Python workflow that brings these two together. You’ll see how to fetch transcripts for any stock, prepare the text, and instantly generate a one-page summary. Whether you’re tracking Apple, NVIDIA, or your favorite growth stock, the process works the same — fast, accurate, and ready whenever you are. Fetching Earnings Transcripts with FMP API The first step is to pull the raw transcript data. FMP makes this simple with dedicated endpoints for earnings calls. If you want the latest transcripts across the market, you can use the stable endpoint /stable/earning-call-transcript-latest. For a specific stock, the v3 endpoint lets you request transcripts by symbol, quarter, and year using the pattern: https://financialmodelingprep.com/api/v3/earning_call_transcript/{symbol}?quarter={q}&year={y}&apikey=YOUR_API_KEY here’s how you can fetch NVIDIA’s transcript for a given quarter: import requestsAPI_KEY = "your_api_key"symbol = "NVDA"quarter = 2year = 2024url = f"https://financialmodelingprep.com/api/v3/earning_call_transcript/{symbol}?quarter={quarter}&year={year}&apikey={API_KEY}"response = requests.get(url)data = response.json()# Inspect the keysprint(data.keys())# Access transcript contentif "content" in data[0]: transcript_text = data[0]["content"] print(transcript_text[:500]) # preview first 500 characters The response typically includes details like the company symbol, quarter, year, and the full transcript text. If you aren’t sure which quarter to query, the “latest transcripts” endpoint is the quickest way to always stay up to date. Cleaning and Preparing Transcript Data Raw transcripts from the API often include long paragraphs, speaker tags, and formatting artifacts. Before sending them to an LLM, it helps to organize the text into a cleaner structure. Most transcripts follow a pattern: prepared remarks from executives first, followed by a Q&A session with analysts. Separating these sections gives better control when prompting the model. In Python, you can parse the transcript and strip out unnecessary characters. A simple way is to split by markers such as “Operator” or “Question-and-Answer.” Once separated, you can create two blocks — Prepared Remarks and Q&A — that will later be summarized independently. This ensures the model handles each section within context and avoids missing important details. Here’s a small example of how you might start preparing the data: import re# Example: using the transcript_text we fetched earliertext = transcript_text# Remove extra spaces and line breaksclean_text = re.sub(r'\s+', ' ', text).strip()# Split sections (this is a heuristic; real-world transcripts vary slightly)if "Question-and-Answer" in clean_text: prepared, qna = clean_text.split("Question-and-Answer", 1)else: prepared, qna = clean_text, ""print("Prepared Remarks Preview:\n", prepared[:500])print("\nQ&A Preview:\n", qna[:500]) With the transcript cleaned and divided, you’re ready to feed it into Groq’s LLM. Chunking may be necessary if the text is very long. A good approach is to break it into segments of a few thousand tokens, summarize each part, and then merge the summaries in a final pass. Summarizing with Groq LLM Now that the transcript is clean and split into Prepared Remarks and Q&A, we’ll use Groq to generate a crisp one-pager. The idea is simple: summarize each section separately (for focus and accuracy), then synthesize a final brief. Prompt design (concise and factual) Use a short, repeatable template that pushes for neutral, investor-ready language: You are an equity research analyst. Summarize the following earnings call sectionfor {symbol} ({quarter} {year}). Be factual and concise.Return:1) TL;DR (3–5 bullets)2) Results vs. guidance (what improved/worsened)3) Forward outlook (specific statements)4) Risks / watch-outs5) Q&A takeaways (if present)Text:<<<{section_text}>>> Python: calling Groq and getting a clean summary Groq provides an OpenAI-compatible API. Set your GROQ_API_KEY and pick a fast, high-quality model (e.g., a Llama-3.1 70B variant). We’ll write a helper to summarize any text block, then run it for both sections and merge. import osimport textwrapimport requestsGROQ_API_KEY = os.environ.get("GROQ_API_KEY") or "your_groq_api_key"GROQ_BASE_URL = "https://api.groq.com/openai/v1" # OpenAI-compatibleMODEL = "llama-3.1-70b" # choose your preferred Groq modeldef call_groq(prompt, temperature=0.2, max_tokens=1200): url = f"{GROQ_BASE_URL}/chat/completions" headers = { "Authorization": f"Bearer {GROQ_API_KEY}", "Content-Type": "application/json", } payload = { "model": MODEL, "messages": [ {"role": "system", "content": "You are a precise, neutral equity research analyst."}, {"role": "user", "content": prompt}, ], "temperature": temperature, "max_tokens": max_tokens, } r = requests.post(url, headers=headers, json=payload, timeout=60) r.raise_for_status() return r.json()["choices"][0]["message"]["content"].strip()def build_prompt(section_text, symbol, quarter, year): template = """ You are an equity research analyst. Summarize the following earnings call section for {symbol} ({quarter} {year}). Be factual and concise. Return: 1) TL;DR (3–5 bullets) 2) Results vs. guidance (what improved/worsened) 3) Forward outlook (specific statements) 4) Risks / watch-outs 5) Q&A takeaways (if present) Text: <<< {section_text} >>> """ return textwrap.dedent(template).format( symbol=symbol, quarter=quarter, year=year, section_text=section_text )def summarize_section(section_text, symbol="NVDA", quarter="Q2", year="2024"): if not section_text or section_text.strip() == "": return "(No content found for this section.)" prompt = build_prompt(section_text, symbol, quarter, year) return call_groq(prompt)# Example usage with the cleaned splits from Section 3prepared_summary = summarize_section(prepared, symbol="NVDA", quarter="Q2", year="2024")qna_summary = summarize_section(qna, symbol="NVDA", quarter="Q2", year="2024")final_one_pager = f"""# {symbol} Earnings One-Pager — {quarter} {year}## Prepared Remarks — Key Points{prepared_summary}## Q&A Highlights{qna_summary}""".strip()print(final_one_pager[:1200]) # preview Tips that keep quality high: Keep temperature low (≈0.2) for factual tone. If a section is extremely long, chunk at ~5–8k tokens, summarize each chunk with the same prompt, then ask the model to merge chunk summaries into one section summary before producing the final one-pager. If you also fetched headline numbers (EPS/revenue, guidance) earlier, prepend them to the prompt as brief context to help the model anchor on the right outcomes. Building the End-to-End Pipeline At this point, we have all the building blocks: the FMP API to fetch transcripts, a cleaning step to structure the data, and Groq LLM to generate concise summaries. The final step is to connect everything into a single workflow that can take any ticker and return a one-page earnings call summary. The flow looks like this: Input a stock ticker (for example, NVDA). Use FMP to fetch the latest transcript. Clean and split the text into Prepared Remarks and Q&A. Send each section to Groq for summarization. Merge the outputs into a neatly formatted earnings one-pager. Here’s how it comes together in Python: def summarize_earnings_call(symbol, quarter, year, api_key, groq_key): # Step 1: Fetch transcript from FMP url = f"https://financialmodelingprep.com/api/v3/earning_call_transcript/{symbol}?quarter={quarter}&year={year}&apikey={api_key}" resp = requests.get(url) resp.raise_for_status() data = resp.json() if not data or "content" not in data[0]: return f"No transcript found for {symbol} {quarter} {year}" text = data[0]["content"] # Step 2: Clean and split clean_text = re.sub(r'\s+', ' ', text).strip() if "Question-and-Answer" in clean_text: prepared, qna = clean_text.split("Question-and-Answer", 1) else: prepared, qna = clean_text, "" # Step 3: Summarize with Groq prepared_summary = summarize_section(prepared, symbol, quarter, year) qna_summary = summarize_section(qna, symbol, quarter, year) # Step 4: Merge into final one-pager return f"""# {symbol} Earnings One-Pager — {quarter} {year}## Prepared Remarks{prepared_summary}## Q&A Highlights{qna_summary}""".strip()# Example runprint(summarize_earnings_call("NVDA", 2, 2024, API_KEY, GROQ_API_KEY)) With this setup, generating a summary becomes as simple as calling one function with a ticker and date. You can run it inside a notebook, integrate it into a research workflow, or even schedule it to trigger after each new earnings release. Free Stock Market API and Financial Statements API... Conclusion Earnings calls no longer need to feel overwhelming. With the Financial Modeling Prep API, you can instantly access any company’s transcript, and with Groq LLM, you can turn that raw text into a sharp, actionable summary in seconds. This pipeline saves hours of reading and ensures you never miss the key results, guidance, or risks hidden in lengthy remarks. Whether you track tech giants like NVIDIA or smaller growth stocks, the process is the same — fast, reliable, and powered by the flexibility of FMP’s data. Summarize Any Stock’s Earnings Call in Seconds Using FMP API was originally published in Coinmonks on Medium, where people are continuing the conversation by highlighting and responding to this story
Share
Medium2025/09/18 14:40
Tom Lee Declares That Ethereum Has Bottomed Out

Tom Lee Declares That Ethereum Has Bottomed Out

Experienced analyst Tom Lee conducted an in-depth analysis of the Ethereum price. Here are some of the highlights from Lee's findings. Continue Reading: Tom Lee
Share
Bitcoinsistemi2026/03/20 19:05