

Bitcoin Up Today: Bounce Toward $70k, But No Confirmed Breakout Yet

Markets are reacting to easing geopolitical tension and institutional flows, so while Bitcoin up today is notable, the structure still looks more like repair than a clean breakout.
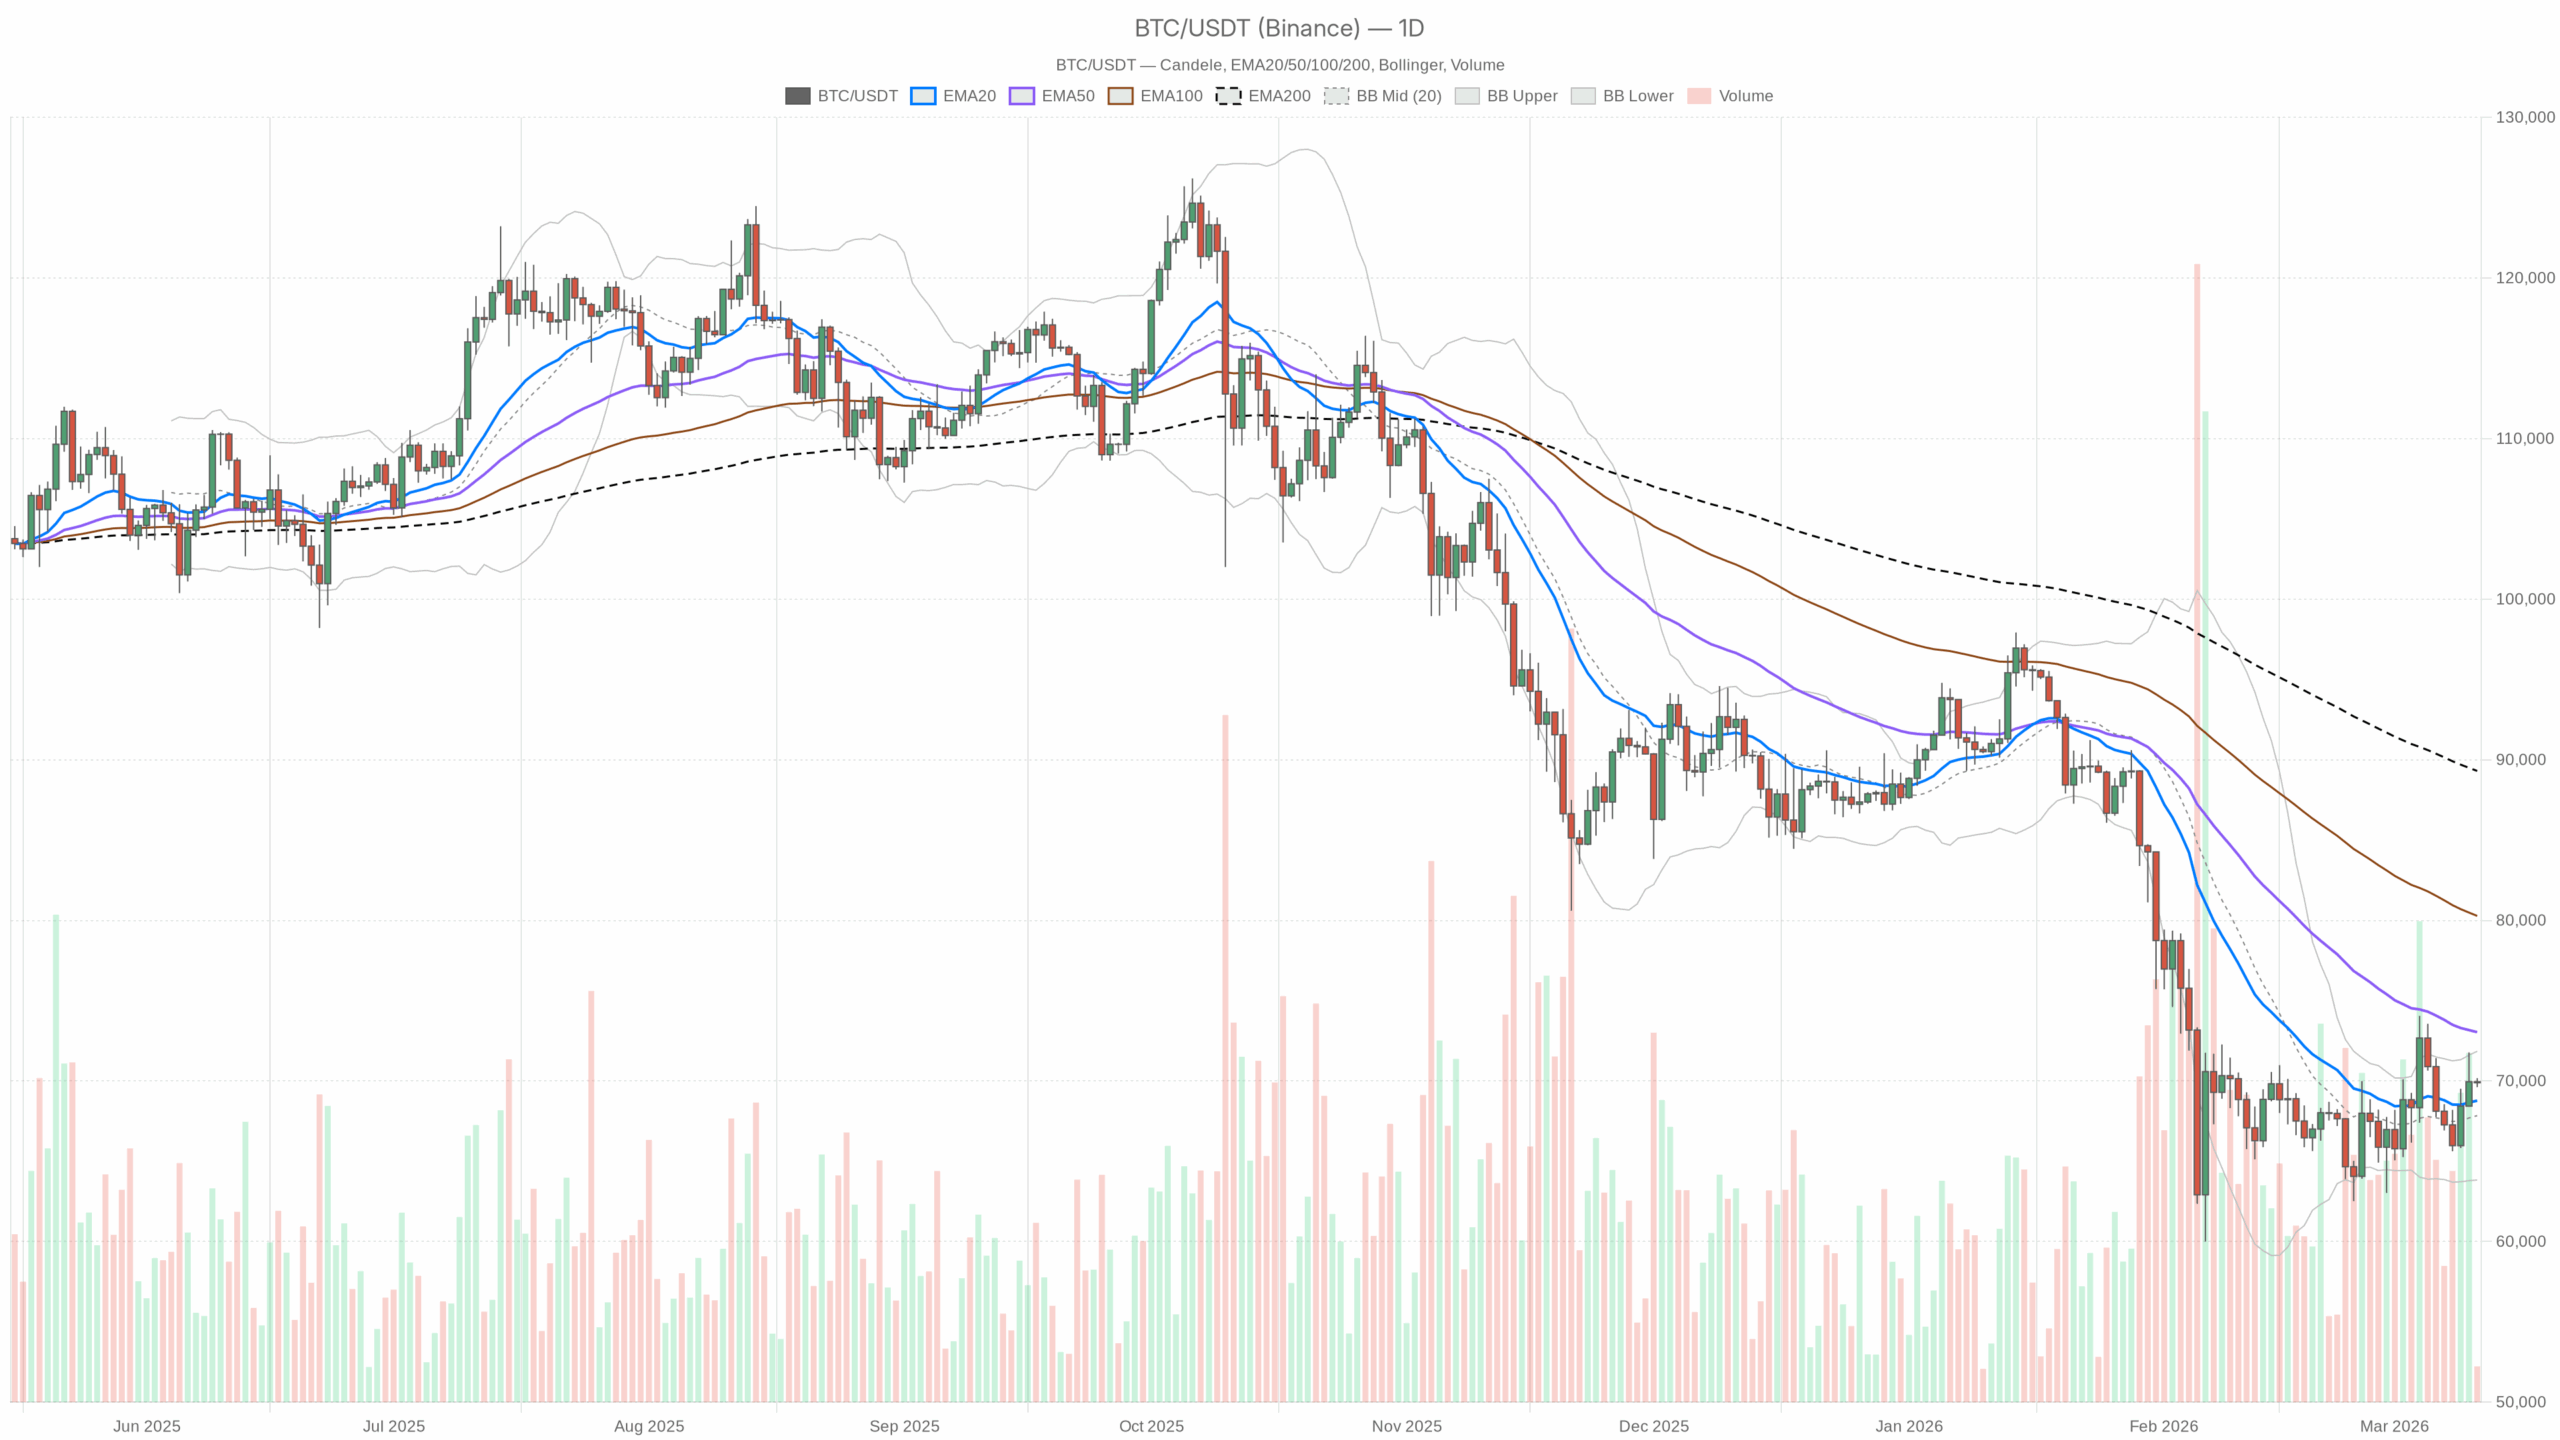 BTC/USDT daily chart with EMA20, EMA50 and volume”
loading=”lazy” />BTC/USDT — daily chart with candlesticks, EMA20/EMA50 and volume.
Bitcoin up today, but is this a real turn or just relief?
Bitcoin has bounced back toward the $70,000 area, helped by easing geopolitical fears and fresh institutional headlines, but the chart is not yet screaming “new uptrend.” On the daily, BTC is recovering off local support and trading just above short-term averages, while higher timeframes still show a market digesting prior excess. The dominant force right now is position adjustment: dip buyers are active, but they are running into a market that is still unwinding leverage and risk after the last leg higher.
Macro context matters here. Total crypto market cap is slightly negative over 24 hours (-0.56%), yet Bitcoin dominance is elevated around 56.9%, and sentiment is pinned in Extreme Fear (Fear & Greed at 15). That cocktail tells you the move up today is more about defensive rotation into BTC than broad speculative risk-on. Bitcoin is up, but the market’s mood is still cautious, not euphoric.
Daily timeframe (D1): Neutral bias with a constructive tilt
Trend & EMAs (Daily)
– Price (close): $69,887
– 20-day EMA: $68,771
– 50-day EMA: $73,037
– 200-day EMA: $89,300
Price has reclaimed the 20-day EMA but remains clearly below the 50-day and far below the 200-day. That signals a market trying to stabilize after a pullback, but still trading within a broader corrective or consolidative phase rather than a clean uptrend. Regime is rightly flagged as neutral.
Interpretation: As long as BTC holds above the 20-day EMA, short-term bulls have some momentum, but the gap to the 50-day and 200-day keeps this move in “repair mode,” not full trend resumption.
RSI (Daily)
– RSI(14): 50.94
RSI is sitting almost exactly in the middle of the range.
Interpretation: Momentum has reset to neutral – neither overbought nor oversold. That is typical of a market that is pausing and deciding whether the recent bounce becomes a new leg up or just a rally to sell.
MACD (Daily)
– MACD line: -778.76
– Signal line: -1437.63
– Histogram: +658.86
The MACD line is still below zero, but importantly it is above the signal line and the histogram is positive.
Interpretation: Medium-term momentum is still damaged from the previous correction, but it has turned upward. This is what you see early in a potential trend repair – improving momentum inside a still-battered structure.
Bollinger Bands (Daily)
– Mid band: $67,840
– Upper band: $71,847
– Lower band: $63,833
Price is trading just above the mid band and below the upper band.
Interpretation: BTC has moved off the lower half of the volatility envelope and is now back in the upper half, but not yet pressing the upper band. That is consistent with a healthy bounce, not a blow-off surge. There is still room for price to travel higher within this volatility channel before it looks stretched.
ATR (Daily)
– ATR(14): $3,326
Daily volatility is elevated but not extreme for Bitcoin at these price levels.
Interpretation: A normal single-day swing of roughly 4–5% is on the table. Position sizing and stop placement need to account for multi-thousand-dollar intraday moves without assuming crisis-level volatility.
Daily Pivot Levels
– Pivot point (PP): $69,891
– Resistance 1 (R1): $70,169
– Support 1 (S1): $69,610
Price is sitting almost exactly on the daily pivot.
Interpretation: The market is literally trading at the day’s balance line. A decisive move away from this area – either through R1 or below S1 – will tell you whether today’s Bitcoin up today narrative has real follow-through or not.
Daily takeaway: The daily chart argues for a neutral-to-constructive stance. The bounce is real, the damage is not fully repaired. The dominant question is whether buyers can keep BTC anchored above the 20-day EMA long enough to drag the 50-day back into play.
1-Hour timeframe (H1): Short-term hesitation under light resistance
Trend & EMAs (1H)
– Price (close): $69,865
– 20-EMA: $70,058
– 50-EMA: $69,503
– 200-EMA: $68,750
On the hourly chart, price is sandwiched between the 20-EMA, just above, and the 50-EMA, just below, while clearly above the 200-EMA.
Interpretation: Intraday trend is still broadly upward versus the 200-EMA, but very near-term momentum has cooled. Short-term traders are pausing right under light resistance around $70,000, which often precedes either a small breakout squeeze or a shallow pullback.
RSI (1H)
– RSI(14): 48.95
RSI is slightly below 50.
Interpretation: Intraday momentum is mildly on the back foot, but nowhere near exhaustion zones. Price action is more about digestion than aggressive selling.
MACD (1H)
– MACD line: 106.07
– Signal line: 263.19
– Histogram: -157.12
The MACD line remains above zero but has crossed below the signal line, giving a negative histogram.
Interpretation: Short-term upside momentum from the recent rebound is losing steam. Bulls are still in control versus the broader intraday trend, with MACD above zero, but they are no longer driving price aggressively higher in this 1H window.
Bollinger Bands (1H)
– Mid band: $70,403
– Upper band: $71,518
– Lower band: $69,287
Price is sitting just under the mid band and above the lower band.
Interpretation: BTC is trading in the lower half of its intraday volatility envelope without hugging the lower band, which fits a controlled consolidation after a move up rather than active distribution.
ATR (1H)
– ATR(14): $687
Hourly volatility is moderate.
Interpretation: Intraday swings of $600–800 are well within normal range. Breaks of intraday levels need to be judged against this noise – a $300 move means very little right now.
Hourly Pivot Levels
– Pivot point (PP): $69,843
– R1: $69,909
– S1: $69,799
Price is hovering almost exactly at the hourly pivot.
Interpretation: In the very short term, the market is undecided. A push above R1 would signal buyers attempting another run; a drift below S1 would increase the odds of a retest toward the hourly lower band and 50-EMA.
Hourly takeaway: The 1H chart softens the daily constructive tone. The rebound is consolidating, not extending. Bulls have the bigger picture on their side versus the 200-EMA, but they are clearly running into near-term hesitation around $70,000.
15-Minute timeframe (M15): Execution context, micro mean reversion
Trend & EMAs (15m)
– Price (close): $69,845
– 20-EMA: $69,943
– 50-EMA: $70,084
– 200-EMA: $69,411
On the 15-minute chart, price is below the 20- and 50-EMA but still above the 200-EMA.
Interpretation: Very short-term flow is in a mild pullback inside a still-respectable intraday uptrend structure. This is classic micro mean reversion after a push higher.
RSI (15m)
– RSI(14): 45.01
Momentum is slightly bearish on this tiny timeframe.
Interpretation: Short-term traders have taken some profits and are probing the downside, but the market is not in oversold territory. There is room for both a bit more dip or a quick intraday reversal.
MACD (15m)
– MACD line: -71.59
– Signal line: -76.43
– Histogram: +4.84
Both lines are below zero, but the MACD line is marginally above the signal line.
Interpretation: Micro momentum has been negative but is trying to curl higher. That is exactly the kind of early signal you would look for if you are timing a very short-term long entry inside a larger bounce.
Bollinger Bands (15m)
– Mid band: $69,894
– Upper band: $70,196
– Lower band: $69,592
Price is almost at the mid band.
Interpretation: Volatility on the 15-minute chart is balanced; price has reverted toward the short-term mean, which often precedes a directional push as liquidity builds.
ATR (15m)
– ATR(14): $222
Short-term volatility is typical for this price level.
Interpretation: A single 15-minute candle swinging $150–250 is normal noise. Tight intraday stops are likely to get whipsawed.
15m Pivot Levels
– Pivot point (PP): $69,836
– R1: $69,896
– S1: $69,786
Price is again right on the pivot.
Interpretation: Microstructure is balanced. Short-term traders are waiting for a nudge before committing either way.
Sentiment, dominance, and the broader risk picture
– Fear & Greed Index: 15 (Extreme Fear)
– Bitcoin dominance: 56.9%
– Total market cap 24h change: -0.56%
We have a familiar pattern: broad crypto is slightly down, but Bitcoin is holding up better, and capital is rotating into BTC while the sentiment gauge flashes fear.
Interpretation: This is not a classic risk-on stampede. It is more a defensive preference for Bitcoin over alts. Bitcoin up today in this context reads as capital preservation within crypto, not exuberant speculation.
Recent news fits that story. Coverage of Bitcoin rebounding toward $71,000 and large-ticket buying from high-profile corporate players adds a narrative tailwind. However, the tape shows that this news is helping to stabilize price rather than ignite a full risk-chasing move.
Main scenario based on the daily chart: Neutral with a bullish lean
The daily timeframe sets the macro bias, and right now that bias is neutral, leaning bullish:
- Price is back above the 20-day EMA, but still well under the 50-day and 200-day.
- RSI is centered, and daily MACD has turned higher but remains below zero.
- Price is in the upper half of the daily Bollinger range but not challenging the upper band.
In other words, Bitcoin is up today, but the move is still a repair rally within a broader sideways-to-corrective structure. The market is no longer in clear downtrend acceleration, yet it has not confirmed a fresh uptrend either.
There is an important tension here across timeframes:
- Daily: improving, supports a constructive bias.
- 1H: stalling under $70,000, mild loss of momentum.
- 15m: micro pullback and mean reversion, waiting for the next shove.
This disagreement is exactly what you expect around a potential inflection zone.
Clear bullish scenario
For bulls, the playbook is a continued trend repair on daily with intraday momentum realigning to the upside.
What bulls want to see:
- Hold above the 20-day EMA (~$68,800): That keeps the current bounce structurally intact.
- Clear break and intraday acceptance above $70,500–71,000: That is roughly where the upper daily Bollinger band ($71,847) starts to matter and where recent rebound highs have been eyed. Strong hourly closes above this region would show fresh demand, not just short covering.
- Daily RSI pressing into 55–60 with MACD histogram expanding further positive: That would mark a transition from neutral repair into outright bullish momentum.
- Hourly and 15m EMAs restacked bullish, with price riding above the 20 and 50 EMA on both timeframes and MACD on those lower timeframes flipping firmly positive again.
Upside potential in this scenario:
- First, a sustained trade in the low $70,000s, leaning on the upper daily band.
- Then, if volatility cooperates, a push to retest the 50-day EMA region near $73,000 as the next structural checkpoint.
What would invalidate the bullish scenario?
- A decisive daily close back below the 20-day EMA, with a clean move under roughly $68,500–68,800, would tell you the current bounce failed.
- Accompanying that, a rollover in daily MACD, with the histogram shrinking back toward zero or negative, and RSI slipping back into the low-40s would mark renewed downside momentum.
- Intraday, a sustained break below the hourly 200-EMA, around $68,750, would signal that even the short-term uptrend structure has been lost.
If those conditions hit, the Bitcoin up today narrative becomes a classic bull trap rather than the start of a new leg higher.
Clear bearish scenario
For bears, the opportunity is that this bounce is just a distribution phase under resistance, fueled by news and defensive flows rather than genuine risk appetite.
What bears want to see:
- Failure to hold above $70,000, with repeated rejections around the daily pivot and the upper Bollinger mid-zone. This is already starting to show on the intraday charts as hesitation.
- Break and hourly acceptance below $69,000–69,200: That would push price into the lower half of the daily band again and below key intraday supports.
- Daily close below the Bollinger mid band (~$67,840): That would shift the daily volatility structure back to bearish control.
- RSI on daily heading back toward 40 and MACD histogram rolling over from positive back toward zero or negative.
Downside potential in this scenario:
- A move toward the lower daily Bollinger band around $63,800 becomes a reasonable target in a renewed risk-off phase.
- Intraday ATRs, with daily around $3,300, mean such a move could unfold over just a handful of sessions if panic returns, especially with sentiment already in Extreme Fear.
What would invalidate the bearish scenario?
- Strong hourly and 4H closes back above $71,000 with expanding volume and volatility skewed to the upside.
- Daily closes held above the mid-to-upper band area, with the 20-day EMA acting reliably as support on dips.
- A clear bullish crossover structure across intraday EMAs, with price consistently supported by the 20 and 50 EMA stacks on 1H and 4H, and a sustained positive MACD on those timeframes.
If bears cannot push price back below key daily averages and volatility bands while sentiment is this fearful, the edge quickly flips toward a more sustained trend repair higher.
Positioning, risk, and how to think about this tape
This is one of those days where Bitcoin up today does not automatically mean the trend is back. The daily structure is healing, intraday momentum is cooling, and the broader market is nervous but not capitulating.
A few practical takeaways for traders and risk managers:
- Respect the daily 20-EMA and Bollinger mid band as the current battleground. Those levels around $68,000–68,800 are the line between a simple pullback within the bounce and a failed recovery.
- Account for volatility in sizing. With daily ATR over $3,300 and hourly ATR near $700, even a quiet day in this regime can produce multi-thousand-dollar swings. Positions that ignore this will feel much more volatile than the chart looks.
- Acknowledge the sentiment skew. Extreme Fear with a relatively resilient Bitcoin and rising dominance often points to a market that has already de-leveraged a fair bit. That can cap immediate downside, but it does not guarantee upside; it mainly means shock moves can be sharp in either direction as positioning is lighter.
In short, Bitcoin is indeed up today, and the daily chart is tilting away from danger. However, the market has not fully committed to a new uptrend. Until BTC can convincingly trade above $70,000–71,000 with intraday trend alignment, traders are dealing with a choppy, news-sensitive range where disciplined risk management and respect for volatility matter more than bold directional calls.
You May Also Like

Saudi Awwal Bank Adopts Chainlink Tools, LINK Near $23

Will Bitcoin Retreat? Wall Street, Kalshi’s US CPI Inflation Estimate as Oil Prices Rebound
