

The Future of Market Simulation: Why Unbiased, Data-Driven Calibration is Key
Table of Links
Abstract and 1. Introduction
2. Relevant Work
3. Methods
3.1 Models
3.2 Summarising Features
3.3 Calibration of Market Model Parameters
4. Experiments
4.1 Zero Intelligence Trader
4.2 Extended Chiarella
4.3 Historical Data
5. Discussion & Future Work
6. Significance, Acknowledgments, and References
5 DISCUSSION & FUTURE WORK
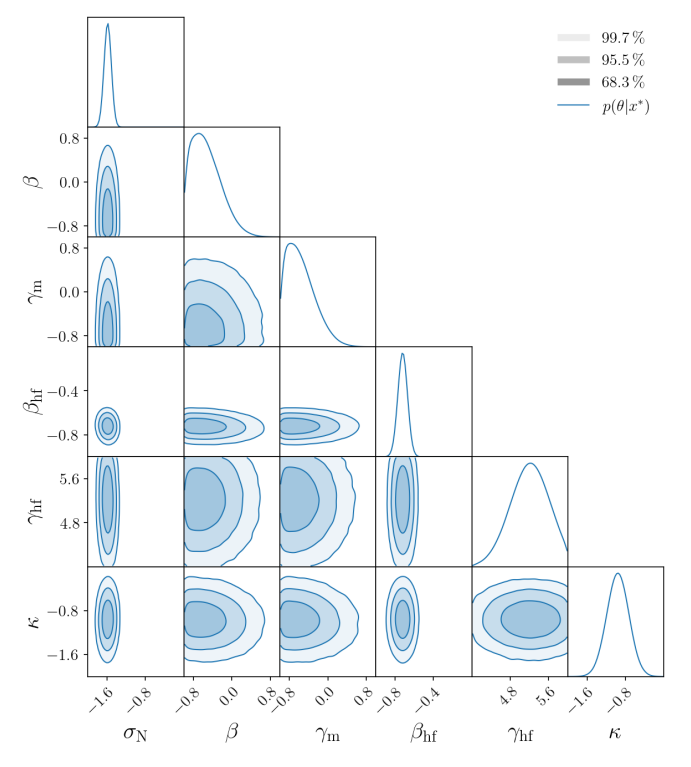
We have shown that the combination of neural density estimators with embedding networks is a robust method for inferring parameters of market simulators. We are able to infer the parameters of two different market simulators with high accuracy and, importantly, these market simulators recreate stylised facts common to both simulated and historical data despite the calibration process being blind to these data. This independence from stylised facts is important as the actual market data does not necessarily follow all stylised facts, as we describe in subsection 4.3. Hence, the determination of which stylised facts are most significant for a single calibration of parameters would require analysis of the underlying observation and an informed choice of weighting across different facts. This is a significant challenge to the scaling of market simulators and introduces a human bias based on which stylised facts to consider.
\ 
\ 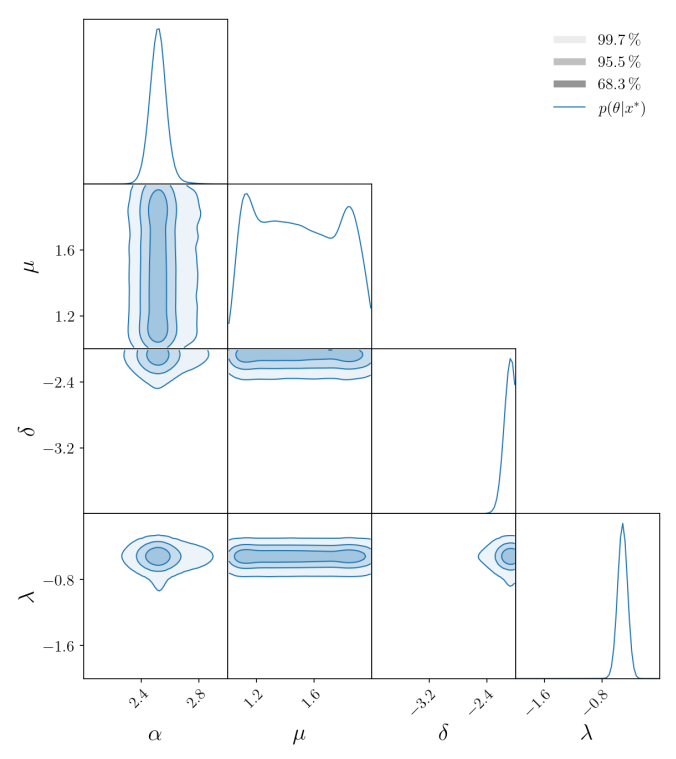
\ Instead, our approach is able to identify parameter sets that reproduce market features with high probability without reliance on analysis of market data. Furthermore, our approach is amortised, such that the trained density estimator is able to rebuild the posterior probability distribution given historical data without needing to be retrained. This is a significant advantage when seeking to calibrate a market simulator to multiple different days or symbols.
\ In this work, we remove the reliance on stylised facts from our calibration procedure by using an embedding network to transform high dimensional simulation output into low dimensional summarising features. While this method is opaque, insofar that it is not clear what the theoretical meaning is of these transformed features, it means that the calibration is data-driven in how it estimates the posterior, without relying on domain knowledge. Here, we use a relatively simple framework for embedding, whereby we convert the mid-price and total volume, or the VWAP at the first level of the LOB, into summary features using a MLP. Future work will explore further improvements to this method by, for example, converting the entire LOB from the day into summary features using neural network architecture with appropriate inductive biases, such as a CNN, as in [43], or GNN, as in [9]. Other work has already demonstrated how GNNs can be used as embedding networks when calibrating agent-based models, as in [18]. However, future work should consider how this approach can be extended to systems where agent dynamics are unobservable.
\ Finally, we note that this work has implications for model misspecification and drift in the context of market simulators. First, we note that the posterior is true under the assumption of a correctly constrained prior and that the model is able to describe the underlying data generation process. In a sense, this reflects the distinction between aleatoric and epistemic uncertainty, where we assume that our observation of the market is accurate (if partial) whereas we are unable to quantify the uncertainty associated with the underlying assumptions of the model. Recent work has begun to address these issues, in the context of simulation-based inference, and it would be interesting to investigate this with respect to market simulators [8, 28]. Second, and related, we note that this work highlights that parameters can be inferred and monitored as an additional heuristic for monitoring changes in market dynamics. This is especially attractive as such an approach with provide a coarse-grained lens to how approximations in the micro-structure behaviours of trading participants alters, with respect to different stressed conditions, for example. Such an approach would, however, be contingent on a degree of confidence in the underlying model approach and, hence, should likely be first conducted in a ‘simulation sandbox’ where ground truths are available. Finally, we note that our approach combines traditional ABM modelling with deep learning in a post-hoc way, where calibration of market behaviours is performed using deep learning. Hybrid models, which combine both deep and traditional approaches at the level of the generation process, are an exciting new research area that maintains the explainability of traditional methods but with increased flexibility from deep learning models. An open question is how these models are calibrated, especially in an amortised way, given the large number of parameters implicit in neural networks. We look forward to steps taken by the field in the direction of these and other difficult questions in the future.
\
:::info Authors:
(1) Namid R. Stillman, Simudyne Limited, United Kingdom (namid@simudyne.com);
(2) Rory Baggott, Simudyne Limited, United Kingdom (rory@simudyne.com);
(3) Justin Lyon, Simudyne Limited, United Kingdom (justin@simudyne.com);
(4) Jianfei Zhang, Hong Kong Exchanges and Clearing Limited, Hong Kong (jianfeizhang@hkex.com.hk);
(5) Dingqiu Zhu, Hong Kong Exchanges and Clearing Limited, Hong Kong (dingqiuzhu@hkex.com.hk);
(6) Tao Chen, Hong Kong Exchanges and Clearing Limited, Hong Kong (taochen@hkex.com.hk);
(7) Perukrishnen Vytelingum, Simudyne Limited, United Kingdom (krishnen@simudyne.com).
:::
:::info This paper is available on arxiv under CC BY 4.0 DEED license.
:::
\
You May Also Like

Microsoft Corp. $MSFT blue box area offers a buying opportunity

IP Hits $11.75, HYPE Climbs to $55, BlockDAG Surpasses Both with $407M Presale Surge!
