

BNB’s Wild Week Ends With Price Compressing Between Two Critical Levels
BNB is trading at $631.53 on March 6, down 3.5% on the day after a week that included one of the sharpest single-session drops on the chart and an equally sharp recovery.
Crypto trader GainMuse identifies the current structure as a descending recovery channel above major support, with buyers gradually compressing price toward a decision point.
What the Week Looked Like
The TradingView two-hour chart covers February 26 through March 6. BNB opened the period around $628, held relatively stable through February 26, then dropped sharply on February 28 to a weekly low of approximately $593. That candle is the most distinctive on the chart, a vertical sell-off that cut through multiple support levels before finding buyers near $593.
The recovery from there was methodical. Price climbed from $593 back to $629 by March 1, pulled back briefly to $613, then launched again on March 2 to $647.
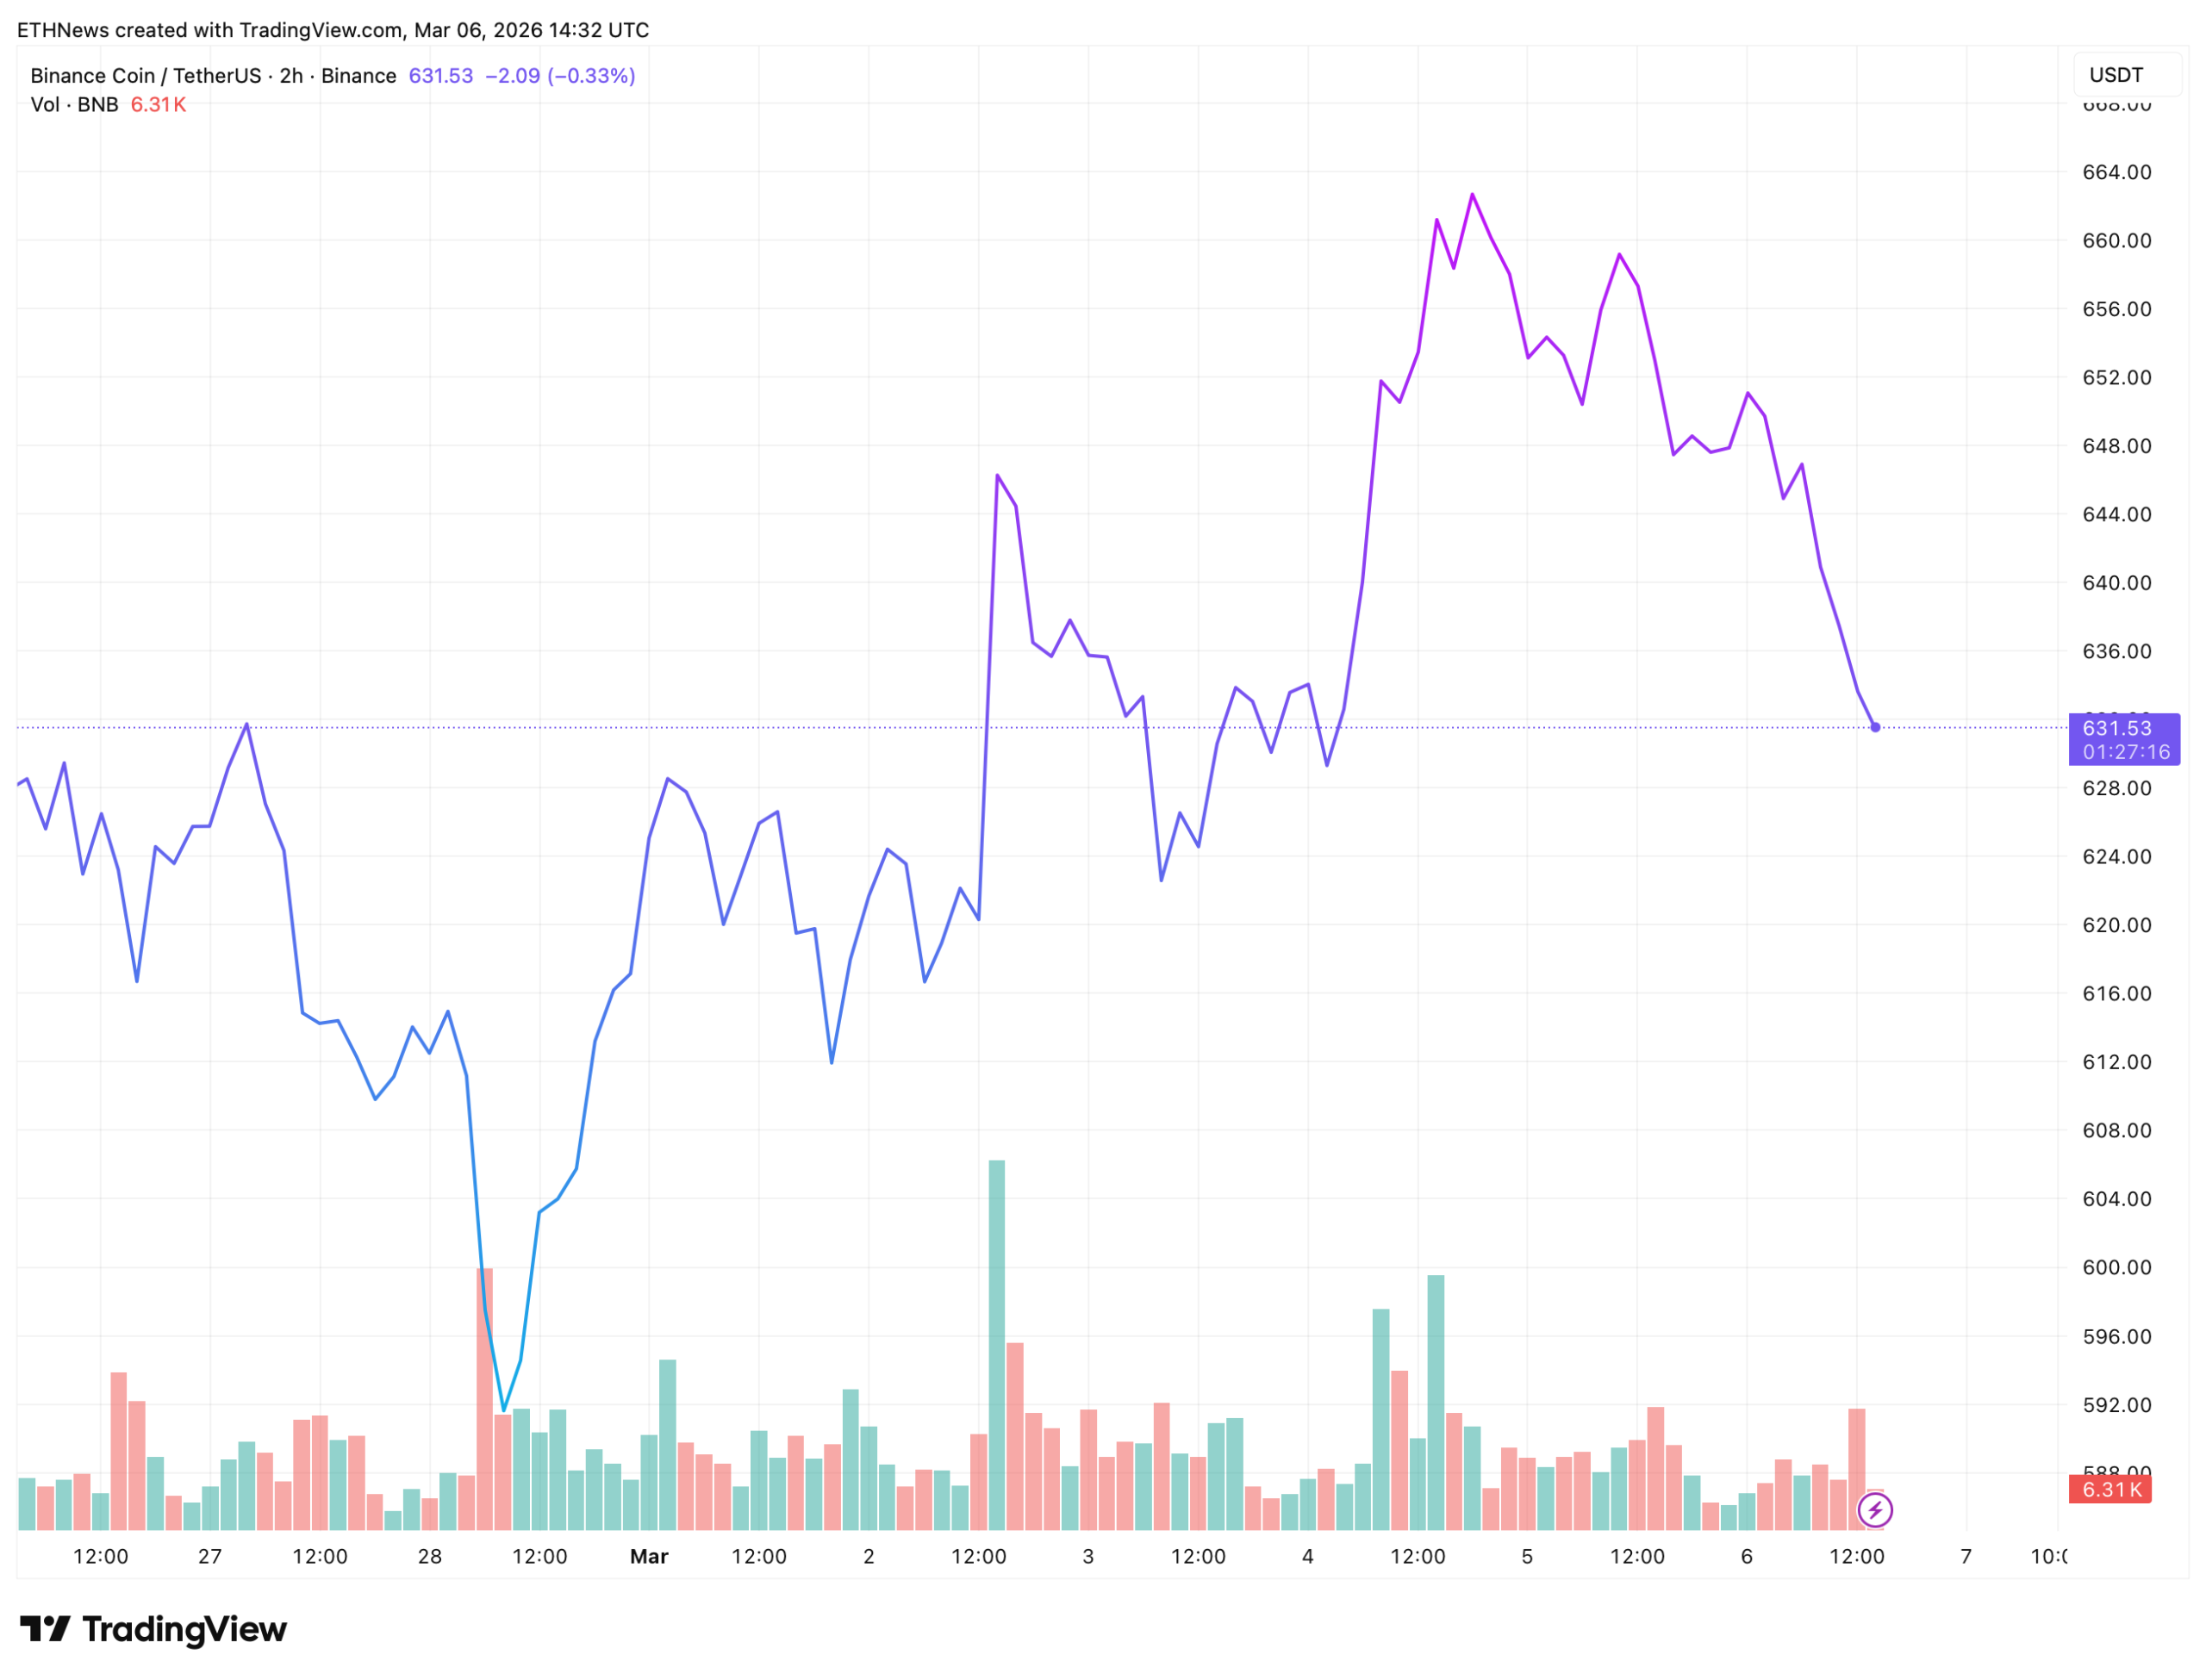 From March 3 onward BNB tracked the broader market rally, reaching a weekly high of $663 on March 4 before the same profit-taking that hit Bitcoin and Ethereum pulled it back. The current $631 represents a 4.8% retracement from that weekly high.
Volume throughout the recovery has been consistent without being exceptional, suggesting accumulation rather than speculative momentum driving the move off the lows.
What Crypto Traders are Watching
The longer-timeframe chart from crypto trader GainMuse shows a more complex structure. BNB broke down from a triangle pattern that had been forming for months, dropped sharply, and is now trading inside a descending channel above a long-term support line. Within that channel, price action is compressing as buyers attempt to regain control against the downward-sloping resistance.
The setup produces two clear scenarios. A breakout above the descending channel resistance could drive price toward $700, the next major resistance zone. A drop below $590 invalidates the recovery structure entirely and suggests the breakdown from the triangle has not yet found its final low.
At $631, BNB sits roughly 11% below the upside trigger and approximately 6.5% above the invalidation level. The risk-reward is asymmetric in the bullish direction but the distance to invalidation is close enough that a single bad session could flip the structure.
The Broader Context
BNB’s weekly performance of 4% covered in Thursday’s top ten market data sits alongside Bitcoin’s 6.41% and Solana’s 3.51%, keeping it broadly in line with the major assets rather than leading or lagging significantly. The compression forming at $631 reflects the same market-wide uncertainty visible across assets today. NFP data arriving this afternoon will likely determine whether this compression resolves upward toward $700 or tests $590 support before the weekend.
The post BNB’s Wild Week Ends With Price Compressing Between Two Critical Levels appeared first on ETHNews.


You May Also Like

MAGA rep gets more than he bargained for as tensions flare during CNN interview

Covéa Chooses Shift Technology as Strategic Partner for Fraud and Risk Management

Bitcoin, Gold, and U.S. Stocks Dive as Trump Pledges to Hit Iran ‘Extremely Hard’


