

Short-Term Pressure And Mean-Reversion Hopes Shape The Price ethereum Outlook

Markets are leaning risk-off and crowding into Bitcoin, leaving the price ethereum action in a fragile stabilization phase around the $2,000 zone.
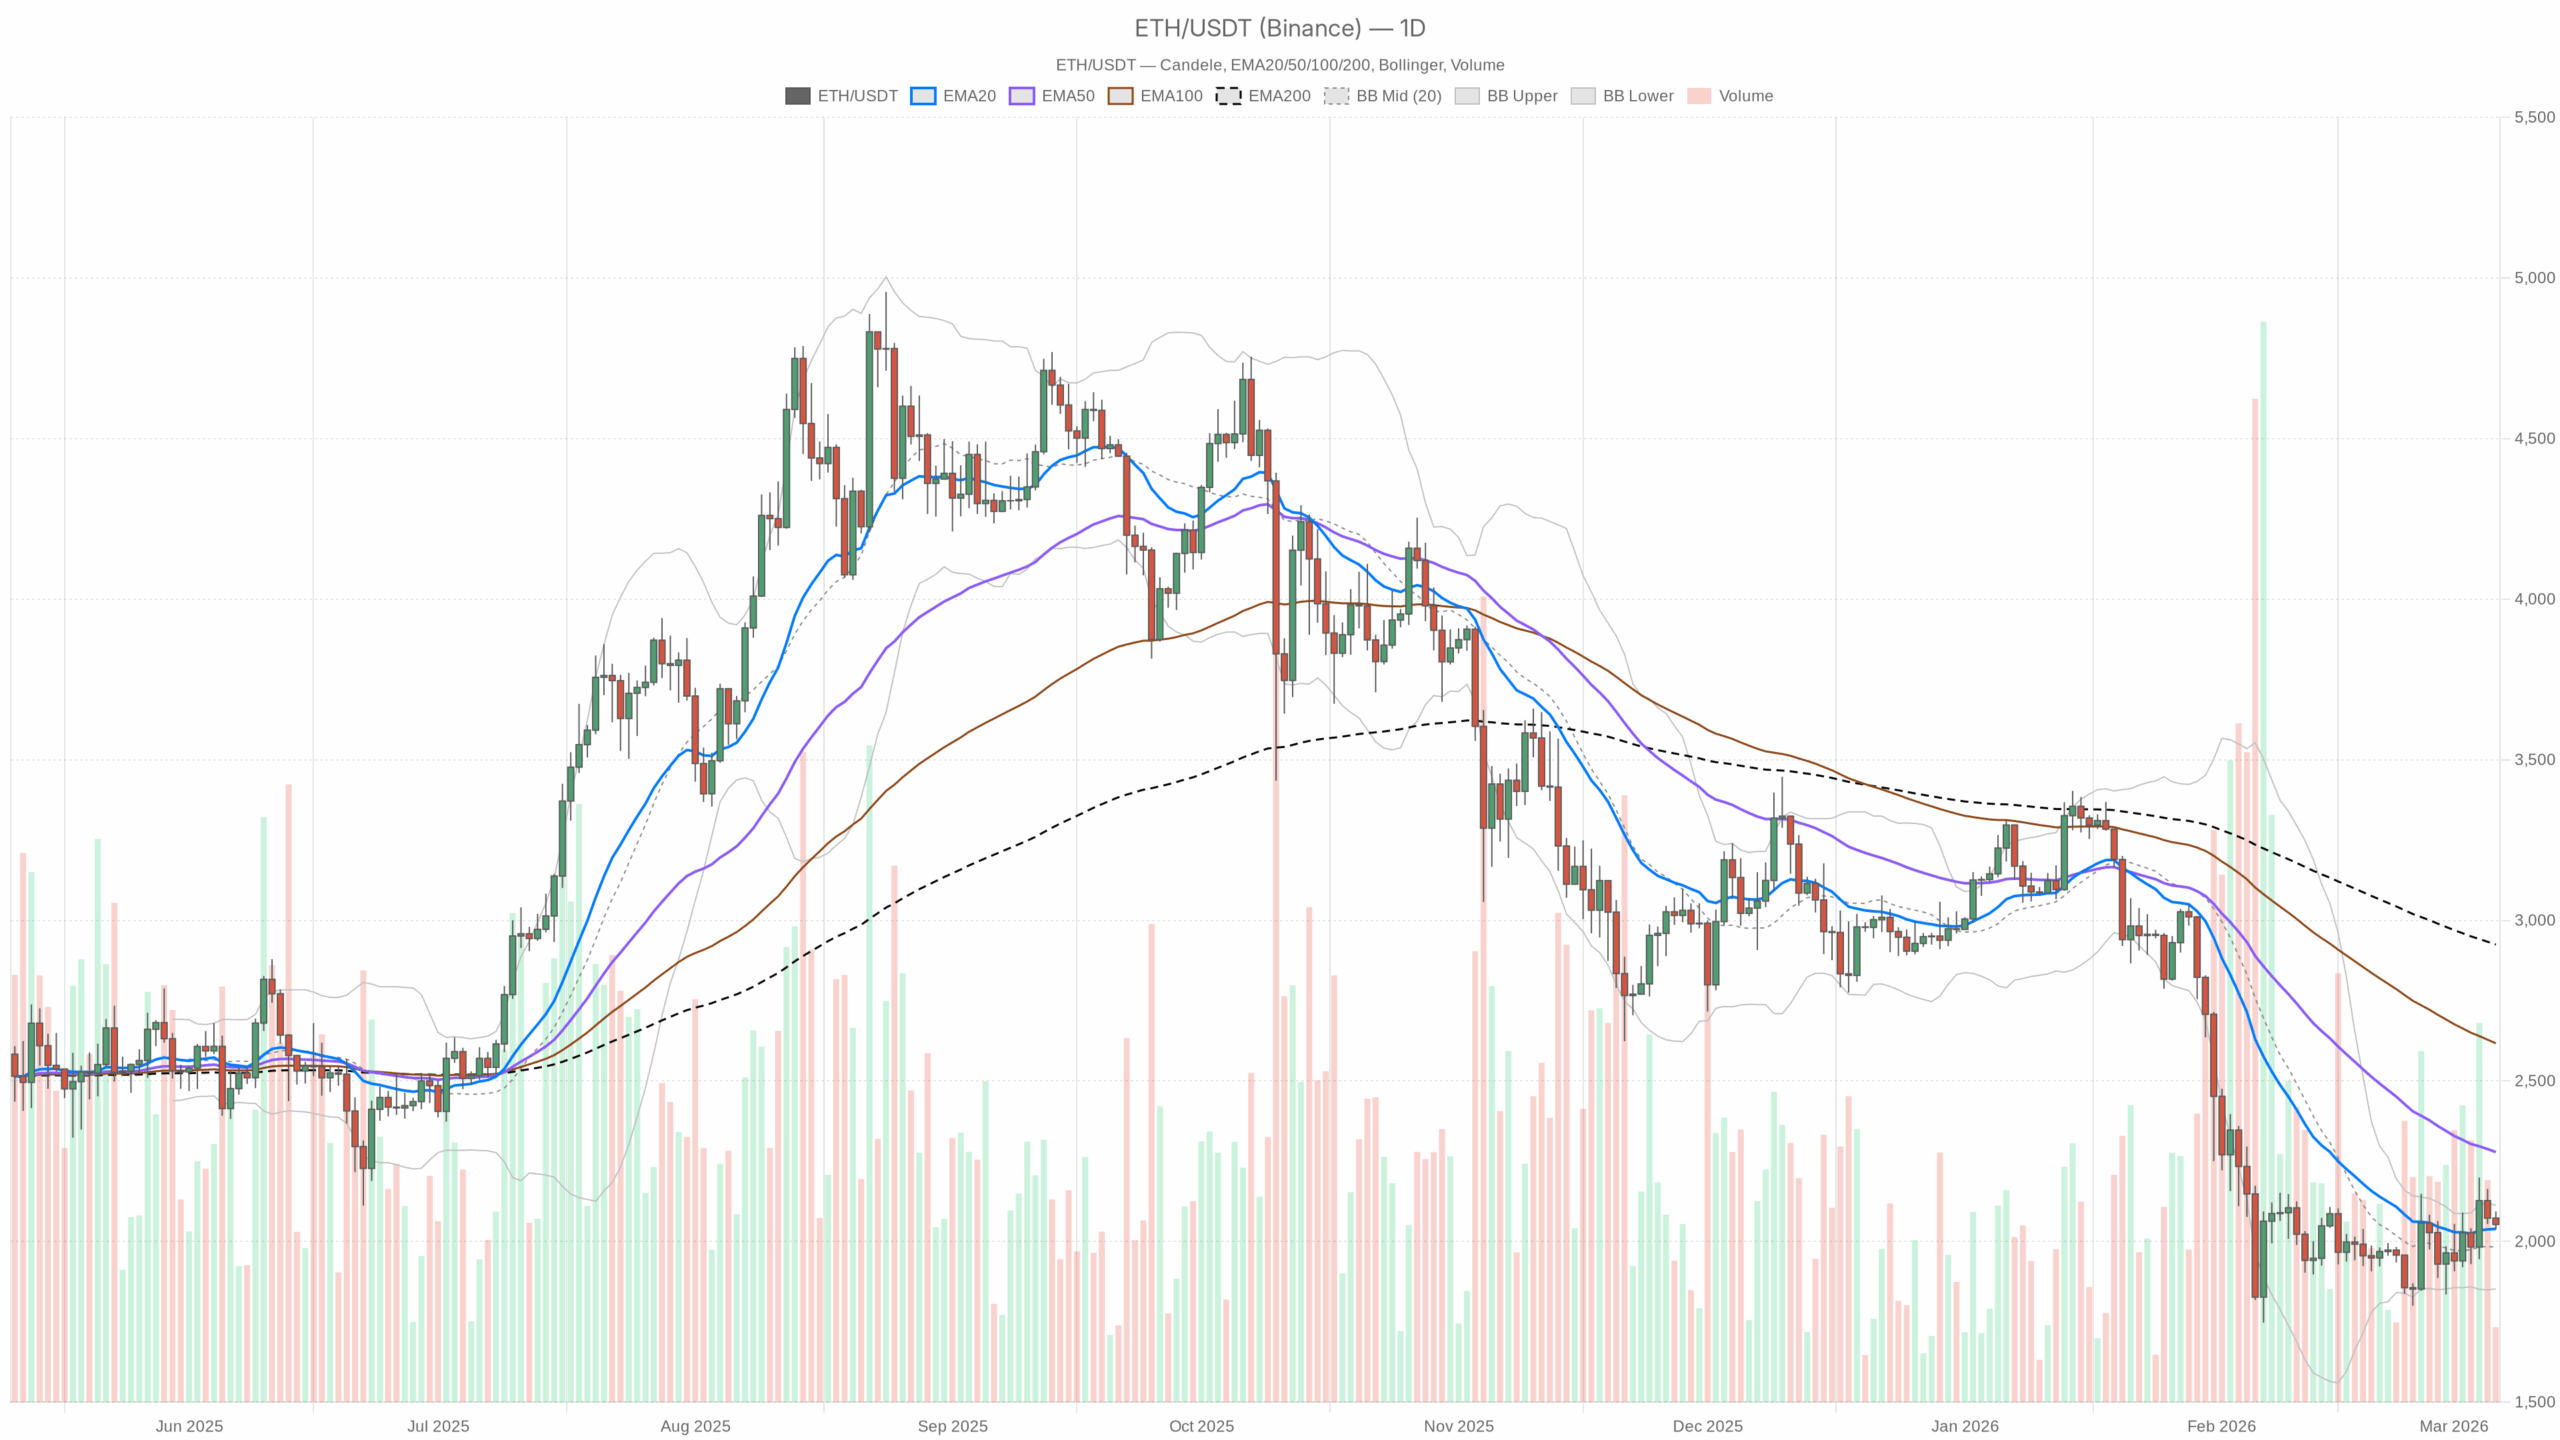 ETH/USDT — daily chart with candlesticks, EMA20/EMA50 and volume.
Market Thesis: Ethereum Sitting in the Crossfire of Risk-Off Flows
Ethereum (ETH) is trading around $2,050, caught between a structurally damaged higher timeframe trend and a short-term attempt to base. The broader crypto market just took a hit: total market cap is down roughly 3.3% in 24h, BTC dominance is pushing above 56.9%, and sentiment is locked in Extreme Fear (18). This is classic capital-rotation behavior into Bitcoin while the rest of the space de-levers.
In this environment, the dominant force is not ETH strength; it is defensive positioning. Traders are trimming altcoin risk and prioritizing liquidity. ETH is not in freefall, but it is clearly not leading. The daily chart shows a market trying to hold a mid-range zone after a heavy drawdown from much higher levels. The big question now is whether ETH consolidates here before another leg lower, or whether this is the early phase of a slow mean reversion higher.
On the daily, the main scenario is neutral leaning slightly bearish. Downside momentum has cooled, but the higher timeframe trend is still damaged and unresolved.
Daily Chart (D1) – Macro Bias: Neutral with a Bearish Hangover
Price & Trend Structure
– D1 close: $2,053.15
– Above EMA20, below EMA50 and EMA200
ETH is sitting just above the 20-day EMA at $2,039 but far below the 50-day EMA at $2,278 and the 200-day EMA at $2,924.
Interpretation: price reclaiming the 20-day is a first step toward stabilization, but as long as ETH is pinned under both the 50-day and 200-day, the broader trend remains broken. This is more of a bounce within a downtrend than a clear bullish reversal.
RSI (Daily)
– RSI(14): 48.05
RSI has clawed its way back toward the midpoint but has not flipped into clear bullish territory.
Interpretation: ETH is neither overbought nor oversold; momentum is flat to mildly constructive. This lines up with a market that has paused after a selloff but has not attracted aggressive dip buyers yet.
MACD (Daily)
– MACD line: -58.91
– Signal line: -101.23
– Histogram: +42.32
The MACD is still below zero, but the line is rising toward the signal and the histogram is firmly positive.
Interpretation: bearish momentum is fading. This is what you typically see in the early phase of a potential mean reversion. The downtrend is losing power, but there is not yet a convincing bullish impulse. It supports the idea of a maturing bottoming attempt, not a confirmed trend change.
Bollinger Bands (Daily)
– Middle band (20SMA proxy): $1,982.63
– Upper band: $2,113
– Lower band: $1,852.25
– Price: just above the mid-band
ETH is trading slightly above the mid-band after previously pressing the lower band area.
Interpretation: price migrating back toward the center of the bands shows volatility normalization after downside pressure. As long as ETH holds above the middle band, bulls have a foothold. A drop back toward $1,850 would reopen the door to trend continuation lower.
ATR (Daily)
– ATR(14): $133.06
Daily range risk is sitting around $130.
Interpretation: this is elevated but not extreme for ETH. Volatility is high enough that a $150–200 move in a day is entirely plausible. This matters for position sizing and stops. The market can move fast, but it is not in a capitulation regime.
Daily Pivot Levels
– Pivot point (PP): $2,061.23
– Resistance 1 (R1): $2,085.25
– Support 1 (S1): $2,029.14
Price is trading just below the daily pivot.
Interpretation: ETH is stuck in a tight daily band around the pivot. Intraday control is marginally with sellers while above S1. A sustained push over $2,085 would show bulls regaining short-term initiative on the daily, whereas a close below $2,030 would signal renewed downside probing.
1-Hour Chart (H1) – Short-Term Bias: Weak and Drifting Lower
On the 1H chart, ETH is soft and failing to hold short-term moving averages, which slightly contradicts the daily stabilization story.
EMAs (H1)
– Price: $2,053.31
– EMA20: $2,075.46
– EMA50: $2,076.53
– EMA200: $2,022.43
Price is below both the 20- and 50-hour EMAs, but still above the 200-hour EMA.
Interpretation: intraday trend is bearish inside a larger consolidation. Short-term sellers are in control as long as ETH remains under $2,075–2,080. However, the fact that price is still above the 200-hour EMA around $2,022 shows the broader intraday structure is more of a pullback than a complete breakdown.
RSI (H1)
– RSI(14): 39.15
RSI is below 40 on the hourly but not oversold.
Interpretation: intraday momentum is tilted bearish. There is mild downside pressure, but no sign yet of panic or forced selling. This fits with a controlled grind lower.
MACD (H1)
– MACD line: -10.19
– Signal line: -7.79
– Histogram: -2.41
The MACD is below zero and below its signal line, with a negative histogram.
Interpretation: short-term momentum is aligned with the downside. Hourly sellers are pressing, and there is no clear sign of an intraday bullish cross yet. This weakens the daily mean reversion bull case in the very near term.
Bollinger Bands (H1)
– Middle band: $2,073.38
– Upper band: $2,095.21
– Lower band: $2,051.55
– Price: near the lower band
ETH is hovering just above the lower hourly band.
Interpretation: price pressing the lower band on H1 shows a modest intraday downtrend. However, there is no violent band expansion, so this is more steady selling than a liquidation cascade. It does, however, leave room for a snapback rally if sellers get exhausted.
ATR (H1)
– ATR(14): $17.59
Hourly ranges are about $17–20.
Interpretation: this is manageable intraday volatility. There is enough movement for active traders, but it is not so extreme that levels are meaningless. Moves between $2,030 and $2,080 can happen quite quickly.
Hourly Pivot Levels
– Pivot point (PP): $2,048.24
– R1: $2,059.27
– S1: $2,042.29
Price is slightly above the hourly pivot.
Interpretation: ETH is oscillating right around the intraday fair value line. Short-term control is undecided, but any push below $2,042 would hand the session to sellers, while reclaiming and holding above $2,059–2,060 would lean the intraday tape back toward buyers.
15-Minute Chart (M15) – Execution Context: Local Downtrend Inside a Bigger Range
The 15-minute chart is in a clear bearish regime, which mirrors the short-term weakness seen on H1.
EMAs (M15)
– Price: $2,053.32
– EMA20: $2,062.61
– EMA50: $2,070.95
– EMA200: $2,074.90
Price is below all the key short-term EMAs.
Interpretation: very short-term trend is clearly down. Every bounce into the $2,063–2,075 area is, for now, a potential sell zone rather than a buy-the-dip level.
RSI (M15)
– RSI(14): 40.61
RSI is weak but not washed out.
Interpretation: there is persistent but orderly selling. No capitulation is visible, which means the short-term downtrend can continue without an obvious need for an immediate snapback.
MACD (M15)
– MACD line: -5.94
– Signal line: -4.42
– Histogram: -1.52
MACD is negative and below the signal line.
Interpretation: intraday momentum on the 15-minute is still pointed lower. Bulls do not have control of the tape at execution level yet.
Bollinger Bands (M15)
– Middle band: $2,065.67
– Upper band: $2,087.92
– Lower band: $2,043.43
Price is trading between the middle and lower band, leaning to the downside.
Interpretation: the micro structure favors sellers but without extreme volatility. A drift toward $2,043 is quite plausible in the short term. A reclaim of $2,066 or higher would indicate buyers are starting to challenge that pressure.
ATR (M15)
– ATR(14): $9.39
Each 15-minute bar is swinging roughly $8–10.
Interpretation: scalpers need to factor in that local moves of $10–15 in minutes are entirely normal in this tape.
15-Minute Pivot Levels
– Pivot point (PP): $2,050.47
– R1: $2,057.05
– S1: $2,046.75
Price is slightly above the 15-minute pivot.
Interpretation: ultra-short term, ETH is fluctuating around micro fair value, but with the trend, EMAs, and momentum pointing lower, the path of least resistance is still down unless buyers step in decisively above $2,057.
Cross-Timeframe Picture: Where the Signals Agree and Conflict
– Daily: neutral with a slight bullish tilt in momentum (MACD improving, RSI mid range, price above 20-day EMA).
– H1 and M15: short-term bearish (price below key EMAs, weak RSI, negative MACD, leaning on lower bands).
There is a clear tension here. The higher timeframe shows a market trying to stabilize after a selloff, while intraday flows are still selling into strength. In practice, that usually means choppy consolidation with downside tests before any sustained recovery.
Moreover, the macro context matters. BTC dominance is near 57%, total crypto cap is down 3.3% on the day, and sentiment is at Extreme Fear. This is a backdrop where rallies in ETH are likely to be sold unless backed by strong volume or a narrative shift. Breakdowns can overshoot support as risk gets de-levered, but also snap back violently once shorts crowd in.
Scenarios for Ethereum Price (ETH)
Bullish Scenario
For the bulls, the play is a continuation of the mean reversion from the recent lows.
What bulls want to see:
- Daily closes above the pivot at $2,061 and more importantly above $2,085 (D1 R1).
- On H1, price reclaiming and holding above the $2,075–2,080 band (20/50 EMA cluster), turning that zone into support.
- RSI on H1 pushing back through 50 with MACD crossing upward toward zero.
If that sequence plays out, the path opens toward the upper daily Bollinger band near $2,113 as the first logical target, then into the $2,180–2,220 region as the next resistance pocket. A later challenge of the 50-day EMA at $2,278 would be the real test of whether this is just a bounce or the start of a medium-term recovery.
What invalidates the bullish case:
- A decisive daily close below $2,000, especially if accompanied by an RSI drop back into the low 40s or below.
- Price losing the mid Bollinger band on D1 (around $1,983) and starting to hug the lower band toward $1,850 again.
That kind of action would indicate the attempted base failed and the downtrend is reasserting itself.
Bearish Scenario
Bears are working with the narrative that this is a dead cat bounce in a still damaged market, amplified by risk-off sentiment and BTC dominance.
What bears want to see:
- Intraday rejection from the $2,060–2,080 region (H1 EMAs and intraday resistance) with price rolling back over.
- A break below $2,030 (D1 S1), followed by sustained trading under $2,000.
- H1 and M15 RSI staying sub 45 while MACD expands further negative, turning the current grind into a more directional leg down.
If bears maintain control, the next key area on the daily structure is the lower Bollinger band near $1,852. That is a logical magnet in a renewed risk-off move. If that level fails, the market is back into a true trend continuation phase rather than just a corrective slide.
What invalidates the bearish case:
- A strong close above $2,100–2,120 with clear reclaim of the 20- and 50-hour EMAs and hourly RSI comfortably back above 50.
- Daily MACD accelerating higher toward a bullish cross above the signal, confirming momentum has genuinely flipped.
That would indicate that sellers have lost their grip and that the bounce is morphing into a sustained recovery attempt. In that context, the price ethereum path could start to shift back toward a more constructive medium-term structure.
Positioning, Risk, and How to Think About This Tape
This is not a clean trending environment for Ethereum. The daily chart is trying to base, but intraday flows are still leaning short. Add in Extreme Fear and a Bitcoin dominated market, and you get a setup where whipsaw risk is high and conviction is low.
For anyone active in this market, the key considerations right now include:
- Timeframe discipline: if you are trading the daily mean reversion idea, be prepared to sit through intraday noise and do not overreact to 15-minute moves. If you are scalping, respect that the higher timeframe is not in full breakdown mode, so strong intraday bounces can and will happen.
- Volatility management: with a daily ATR around $133, sizing needs to account for the fact that a $100 swing is just one day of normal movement, not an outlier.
- Context awareness: in a risk-off backdrop with BTC dominance rising, ETH can underperform even if it does not collapse. That favors tactical, level by level trading over big, directional bets until the daily trend is clearly re established above the 50-day EMA or breaks down through the lower band.
The market is still searching for balance. Until that resolves, expect Ethereum’s price to stay noisy around this $2,000–2,100 band, with both sides at risk of punishment if they become too confident too early.


You May Also Like

Covéa Chooses Shift Technology as Strategic Partner for Fraud and Risk Management

Not a loophole: Singapore AI export controls let China tap US AI legally

Top U.S. economist says Gold reversal is imminent


