Bitcoin Reclaims Key $70,000 Zone as BTC Whales Reduce Selling Pressure: Analysis
Bitcoin breaks past $70K as BTC whale selling pressure drops 65% with analysts watching for bullish continuation or short-term pullback.
Bitcoin is back in focus after reclaiming the critical $70,000 price level this week. The crypto posted a strong 4.33% daily gain, pushing its price to approximately $71,292 as of this writing.
Crypto analysts flagged the move, with some calling the current action “decision time” for BTC. Alongside the price action, on-chain data show a major shift in whale behavior.
Institutional-sized wallets that had been selling into every rally are now pulling back from that pressure.
Bitcoin Price Action and Bollinger Band Breakout
According to a daily chart analysis on Gate.io, Bitcoin broke above its recent consolidation range near $69,000 to $70,000.
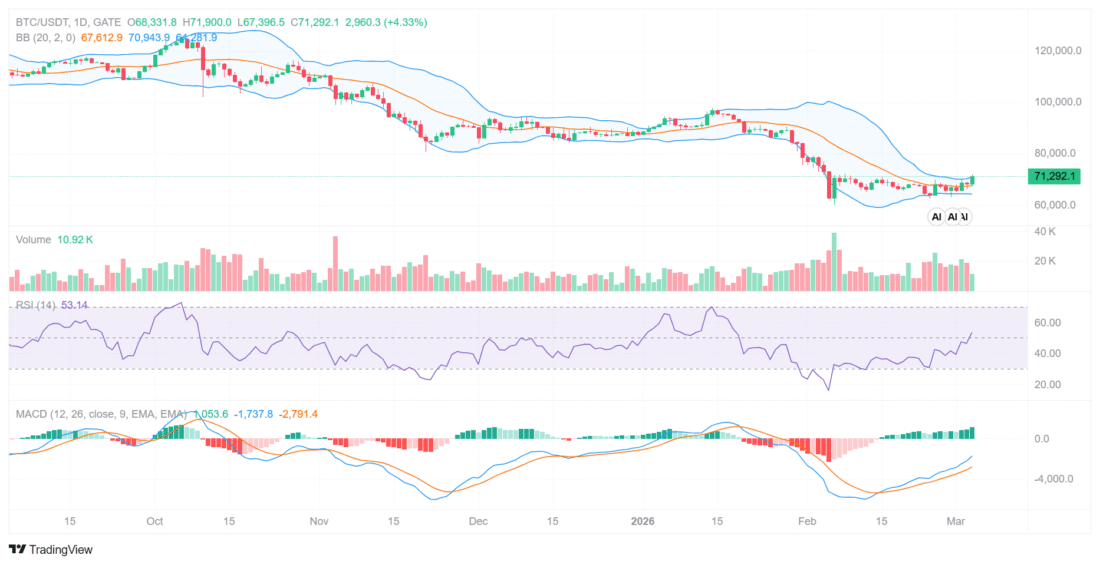 Bitcoin price breaks higher as momentum improves, Source| Gate.io
The breakout candle closed above the upper Bollinger Band, sitting near $70,943. That kind of close signals strong bullish momentum. But it also points to short-term overextension.
The Bollinger Bands are starting to expand after a period of compression. That expansion signals rising volatility in the market. The 20-day moving average, sitting around $67,613, now acts as a key dynamic support level. A pullback toward that zone would still keep the bullish structure intact.
Market analyst Lennaert Snyder outlined two key scenarios to watch.
In the bullish case, Bitcoin holds above $70,200, consolidates, and then pushes higher before the end of the week. In the bearish case, price sweeps liquidity above recent highs, gets rejected, and triggers a short setup on what Snyder called a “bearish MSB.”
He added that increased volume during the breakout helps validate the move.
Immediate resistance sits between $72,000 and $73,500. Beyond that, a major supply zone runs from $75,000 to $78,000.
Support levels to watch include $70,000 as a psychological floor, $67,500 to $68,000 as the Bollinger mid-band region, and $62,000 to $64,000 as a deeper structural base.
RSI and MACD Signal Early BTC Momentum Recovery
The 14-period RSI currently sits around 53, climbing out of oversold territory it hit in February near 30. The reading places Bitcoin in neutral-to-bullish territory.
Importantly, it has not yet reached overbought levels above 70. That leaves room for further upside before any momentum-driven reversal becomes a concern.
The MACD tells a similar story. The histogram has turned green after a long stretch of negative readings. The MACD line is crossing upward toward the signal line. This is an early-stage bullish crossover.
However, the MACD remains below the zero line, which means the trend recovery is still in its early phase rather than a confirmed full bullish trend.
No bearish divergence is visible at this point. If the RSI pushes above 60, that would confirm stronger bullish continuation. For now, the combined RSI and MACD picture suggests selling pressure is easing and buyers are slowly regaining control of the market.
The volume profile further supports the recovery thesis.
Recent green volume bars came in higher than during the consolidation phase. The breakout candle saw increased participation, which validates the move. There is no climax volume yet, which suggests the rally is not exhausted.
Related Reading: $1B Floods Into Crypto Funds as Bitcoin Pulls Massive $881M Inflows
BTC Whale Selling Pressure Drops 65% in One Week
Beyond the chart, a notable on-chain development is happening.
Ardi, a crypto analyst, shared that the Whale vs Retail Delta has shifted sharply. The metric dropped from a negative 15 to negative 4.9 over the past week. That amounts to roughly a 65% reduction in net selling pressure from large wallets.
Ardi noted that these institutional-sized wallets had been consistently net selling for the previous month. Every rally higher during that period faced heavy distribution from these participants. The behavior kept a ceiling on Bitcoin price gains.
Now, for the first time in months, the selling is cooling off.
The analyst drew a comparison to a similar delta recovery seen during the $90,000 to $97,000 rally. Ardi was careful to note that this does not guarantee a repeat of that move.
The whales have not flipped to net buying yet. They have simply moved from heavy selling to near-neutral, which is still a meaningful shift in market dynamics.
This change in whale behavior, combined with the technical breakout above $70,000, is drawing attention from analysts watching the market. As long as Bitcoin holds above the $67,500 to $68,000 support zone, the bullish structure remains in play.
A daily close below that range would reopen downside risk toward the $64,000 level.
The post Bitcoin Reclaims Key $70,000 Zone as BTC Whales Reduce Selling Pressure: Analysis appeared first on Live Bitcoin News.
You May Also Like

Litecoin Fluctuates Below The $116 Threshold

CME to launch Solana and XRP futures options on October 13, 2025