

Solana Price Prediction: SOL Builds Base Structure Amid $120 Breakout Target
Key Insights:
- Solana price consolidates between $80 support and $95 resistance after a 30-day consolidation phase.
- Repeated higher lows inside the range signal weakening sellers and steady demand absorption.
- A confirmed breakout above $95 could open momentum toward the $110–$120 supply zone.
Solana price continues trading within a defined consolidation range as volatility compresses. Solana’s price is currently near $85 after stabilizing above key support. Multiple analysts highlight a base formation between the $80 and $95 price levels. A confirmed breakout could lead to the $120 zone.
Solana Price in Range Between $76 and $90
According to Ali Martinez, the 4-hour chart shows a clear horizontal range. Resistance is around the $90 level, and support is near the $76 level. The middle pivot at around $83 serves as a balance zone. This setup shows consolidation after a previous impulsive action.
Moreover, repeated rejections near resistance indicate intense overhead supply. Each rally into the zone resulted in quick pullbacks. Buyers, on the other hand, are always defending the support zone of $76. These responses confirm the range and indicate liquidity concentration at either end.
 SOLUSD 4H CHART | SOURCE: X
The mid-range pivot at $83 remains critical for short-term direction. When trading persists beyond this point, then the chances of a second resistance test are high. Acceptance below the pivot also exposes the lower boundary. These levels within the range of conditions determine the intraday momentum.
A decisive breakout above $90 would invalidate the current rotation. This action would cause expansion to higher resistance levels. Conversely, a breakdown of the $76 level would validate continuation on the bearish side. Solana price remains held within established limits.
Horizontal Compression Signals SOL Price Pressure
Meanwhile, Shiller presented a tactical consolidation perspective. After a steep decline, SOL price stabilized between the $80 support and the $88 resistance. Repeated interactions between the two zones define a narrow horizontal channel. This formation developed after an aggressive downward phase.
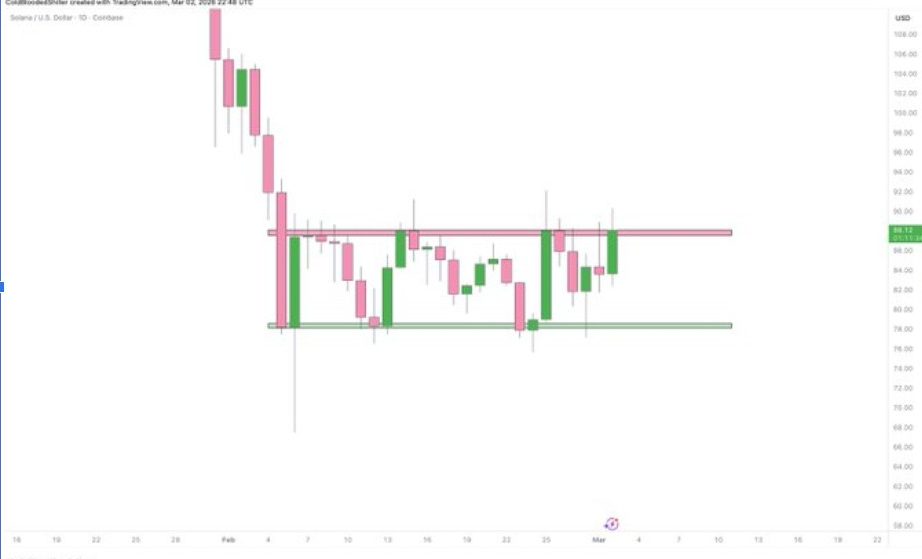 SOLUSD 1D CHART | SOURCE: X
Additionally, the lower band has been tested several times. Buyers continue absorbing supply at that level. However, the resistance band near $90 remains firm. Each upward attempt has stalled beneath that ceiling.
Notably, price action shows tightening volatility near resistance. The horizontal cap is developing higher lows. This compression precedes expansions during liquidity accumulation. A sustained breakout above $90 would lead to further shifts to higher supply zones.
On the downside, rejection at resistance may lead to a retest of support. That scenario could expose deeper retracement levels near $75. For now, the asset remains locked inside the consolidation box.
SOL 30-Day Base Structure Targets $120
In addition, Shah highlighted a broader structural shift on the daily timeframe. After peaking near $145, SOL entered a long-term corrective pattern. The correction extended down to the $80 support level before stabilizing. Over the past 30 days, the price has formed a tight sideways range.
 SOLUSD 1D CHART | SOURCE: X
This consolidation is defined between the $80 support level and the $95 resistance zone. Several rejections from the upper limit validate active supply. Meanwhile, there is repeated accumulation close to the $80 range. The progressive development of the higher lows implies weakened seller momentum.
The price ceiling around $95 points to a breakout. A decisive close above this range would confirm expansion. Technical projections mark the next supply zone between $110 and $120. This zone concurs with the breakdown structure in the previous trend.
The inability to hold the support would nullify the base-building thesis. Such a breakdown may extend into the liquidity range of $70. However, prolonged consolidation often creates breakout opportunities in the long term.
The post Solana Price Prediction: SOL Builds Base Structure Amid $120 Breakout Target appeared first on The Market Periodical.


You May Also Like

Ares Strategic Mining Establishes New Investor Relations Team Following $10 Million Funding

Silver Price Drops Near $67.50 as Oil Weakness and Fed Rate Worries Weigh

JPMorgan Flags Sharp Slowdown in Crypto Inflows to Start 2026


