

PUMP Price Jumps 7.9%, Breaks Resistance: Can $0.0017 Hold?
This article was first published on The Bit Journal.
PUMP price analysis reflects a market where short-term optimism is meeting a broader tone of caution. Recent trading activity has pushed prices and volumes higher, yet strong confidence is still missing beneath the surface.
Traders appear to be reacting to short-term signals instead of committing to a clear market direction. As a result, market positioning remains careful, even with increased participation and activity.
What does PUMP price analysis indicate about the current market setup?
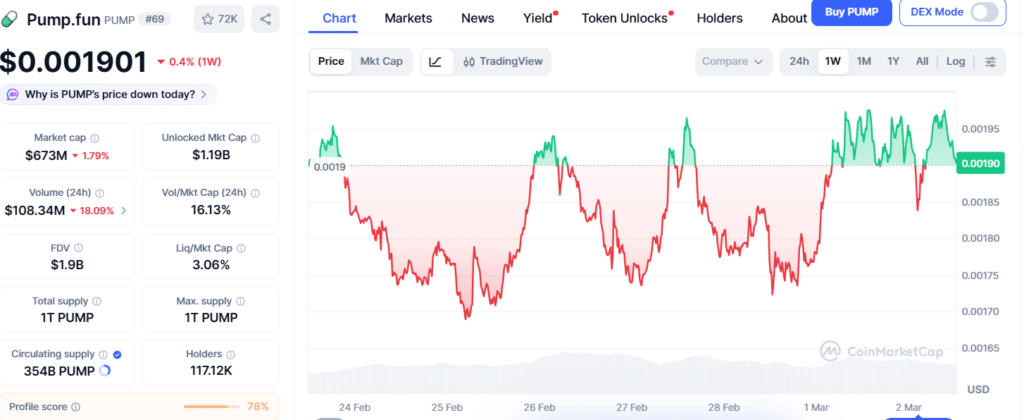
The PUMP price analysis shows that Pump.fun’s token previously recorded a 7.9% rise, alongside a 9.61% increase in trading activity. The token is currently trading around $0.001907, reflecting a 1.42% decline over the past 24 hours, while still holding a 0.38% gain on the weekly timeframe.
 PUMP Price Jumps 7.9%, Breaks Resistance: Can $0.0017 Hold? 3
Current trading volume stands at $108.76 million, down 18.68% over the last day, based on data from CoinMarketCap. The move followed a break above a two-week descending trendline, which briefly raised reversal expectations, but despite spot-market outflows pointing to aggressive accumulation, the broader daily structure remains bearish.
How has the token traded within its broader price range?
Since December, the price has mostly moved within a clear range between $0.0017 and $0.0034. During this period, several internal shifts have occurred, showing that market sentiment has been uneven rather than stable.
The latest shift took place on February 5, when the $0.00225 higher low failed to hold. This move strengthened the bearish bias that continues to shape how the market is behaving now.
Why does the $0.0017 support level continue to matter?
The $0.0017 level has repeatedly acted as a dependable local support for Pump.fun’s token. It was first defended in late December 2025 and has once again held firm against downward pressure, preventing further losses in the short term.
During this period, on-balance volume has moved sideways, showing stability in trading activity even as price oscillated within its range. This flat OBV reading suggests that neither the bulls nor the bears currently have the upper hand, a situation that PUMP price analysis identifies as a sign of market indecision and balanced forces.
What do momentum and volume indicators suggest now?
Momentum indicators show neutral short-term trend for PUMP. The 1-day relative strength index (RSI 14) stands at 44.28 that indicates a neutral stance without a clear bias toward bulls or bears.
Meanwhile, the MACD level (12, 26) reads −0.0001146, suggesting a mild buy signal. These signals align with the broader PUMP price analysis, highlighting indecision and a cautious outlook for the token.
Is the short-term move best described as a liquidity hunt?
In short term run PUMP price analysis suggests that the token is moving mainly to hunt liquidity rather than start a sustained trend. Over past week PUMP has been trading between $0.00170 and $0.00197.
Price recently faced rejection near the top of this range, which pushed it lower again. This shows that near-term moves are being shaped more by liquidity levels than by strong bullish momentum.
How are traders approaching rallies toward higher levels?
Traders are approaching upside moves with caution and discipline rather than chasing gains. Liquidity concentrated near $0.00166–$0.00170 remains a key focus for market participants on the downside.
 PUMP Price Jumps 7.9%, Breaks Resistance: Can $0.0017 Hold? 4
Any rally toward $0.0022–$0.0024 is being treated as an explicit sell-into-strength opportunity. This strategy reflects the current market approach and cautious positioning observed among participants.
Conclusion
PUMP price analysis shows that the daily trend remains bearish despite recent gains and signs of accumulation. The ongoing range-bound structure suggests that patience is the preferred approach for traders.
While a short squeeze is possible the traders are cautioned not to mistake a quick range breakout for a true trend reversal. Until strong spot-market demand emerges to shift the balance, selling into strength continues to guide market behaviour.
Disclaimer: This article is for informational purposes only and does not constitute financial advice. Cryptocurrency investments carry high risk, and readers should conduct their own research or consult a professional before making any trading decisions.
Glossary
Bearish Bias: Ongoing downside pressure despite temporary rebounds.
Spot Outflows: Tokens leaving exchanges often indicate accumulation.
OBV: Volume indicator measuring buying and selling pressure strength.
RSI: Momentum tool showing whether the price is overbought or oversold.
Liquidity Hunt: Brief price move aimed at triggering stop orders.
Frequently Asked Questions About PUMP Price Analysis
What is happening to PUMP price right now?
PUMP price recently increased by 7.9%. And is now trading near $0.0019 with slight daily weakness.
Why did PUMP price increase recently?
PUMP price increased after breaking short-term trendline. And is seeing higher trading volume.
Why is $0.0017 an important level?
The $0.0017 level is important as it has acted as strong support and prevented further price drops.
How are traders reacting to price rallies?
Traders are reacting cautiously and are selling during rallies instead of buying at higher prices.
Is PUMP still in a bearish trend?
Yes, the overall daily structure still shows a bearish trend despite short-term gains.
Sources
AMBCrypto
CoinMarketCap
Tradingview
Read More: PUMP Price Jumps 7.9%, Breaks Resistance: Can $0.0017 Hold?">PUMP Price Jumps 7.9%, Breaks Resistance: Can $0.0017 Hold?


You May Also Like
Bitcoin Price Prediction – BTC Price Estimated to Reach $ 82,449 By Jun 02, 2026

XRP Price Slides Sharply Lower As Selling Pressure Intensifies Rapidly

The Africa GCC Corridor: Capital, Growth & Partnership


