Spot Bitcoin ETFs recorded $332.7 million in inflows on September 2, led by Fidelity’s FBTC with $132.7 million, as BTC price bounced back to $111,000. The post Bitcoin ETF Inflows Resume Sparking “Digital Gold” Narrative, Ether ETFs Bleed appeared first on Coinspeaker.Spot Bitcoin ETFs recorded $332.7 million in inflows on September 2, led by Fidelity’s FBTC with $132.7 million, as BTC price bounced back to $111,000. The post Bitcoin ETF Inflows Resume Sparking “Digital Gold” Narrative, Ether ETFs Bleed appeared first on Coinspeaker.

Bitcoin ETF Inflows Resume Sparking “Digital Gold” Narrative, Ether ETFs Bleed

Amid the broader crypto market correction, Bitcoin BTC $111 626 24h volatility: 2.8% Market cap: $2.22 T Vol. 24h: $46.14 B is once again emerging as a safe haven asset, regaining the “digital gold” narrative amid the global macro uncertainty.

Inflows into spot Bitcoin ETFs surged on September 2, recording a total of $332.7 million. On the other hand, Ethereum ETH $4 364 24h volatility: 1.7% Market cap: $526.92 B Vol. 24h: $32.42 B ETFs have seen outflows of $135 million on September 2.

The shift follows a strong August for Ethereum funds, which recorded $3.87 billion in inflows, while Bitcoin ETFs faced $751 million in outflows.

Fidelity Leads Bitcoin ETF Inflows

Fidelity’s Wise Origin Bitcoin Fund (FBTC) topped the inflow charts with $132.7 million, followed by BlackRock’s IBIT at $72.8 million.

Other major issuers, including Grayscale, Ark 21Shares, Bitwise, VanEck, and Invesco, also reported additional inflows, as per data from SoSoValue.

bitcoin etf net inflows

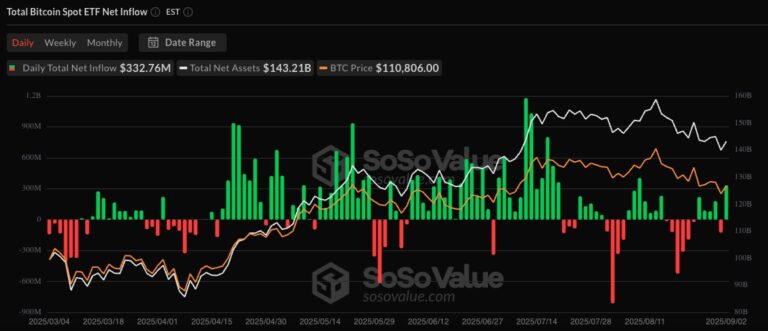
Bitcoin ETF inflows are on the rise again. | Source: SoSoValue

The latest uptick in spot Bitcoin ETF inflows coincides with the resurgence of Bitcoin’s “digital gold” narrative.

Crypto investment products saw a strong rebound last week, recording $2.48 billion in net inflows following $1.4 billion in outflows the week before.

Bitcoin price took a dive under $107,500, before recovering once again to $111,000, which is its 20-week simple moving average (SMA).

Spot Ethereum ETFs Are Bleeding

Ether ETFs experienced significant outflows, with Fidelity’s FETH leading the decline at $99.2 million, followed by Bitwise’s ETHW with $24.2 million. On August 29 alone, Ether ETFs recorded a total of $164 million in withdrawals.

These outflows come as Ethereum price has been under selling pressure, and is currently trading under $4,400.

Analyst Benjamin Cowen expects Ethereum to drop to its 21-week EMA within the next 4-6 weeks, after which it could rally to new all-time highs, with a final rotation into Bitcoin this cycle.

As shown in the image above, the ETH price could potentially drop to $3,400 by September-end. There’s a possibility for another 20% correction from here before ETH resumes its Q4 rally to new all-time highs.

next

The post Bitcoin ETF Inflows Resume Sparking “Digital Gold” Narrative, Ether ETFs Bleed appeared first on Coinspeaker.

Market Opportunity
Bitcoin Logo
Bitcoin Price(BTC)
$87,456.49
$87,456.49$87,456.49
+0.36%
USD
Bitcoin (BTC) Live Price Chart
Disclaimer: The articles reposted on this site are sourced from public platforms and are provided for informational purposes only. They do not necessarily reflect the views of MEXC. All rights remain with the original authors. If you believe any content infringes on third-party rights, please contact service@support.mexc.com for removal. MEXC makes no guarantees regarding the accuracy, completeness, or timeliness of the content and is not responsible for any actions taken based on the information provided. The content does not constitute financial, legal, or other professional advice, nor should it be considered a recommendation or endorsement by MEXC.

You May Also Like

FCA komt in 2026 met aangepaste cryptoregels voor Britse markt

FCA komt in 2026 met aangepaste cryptoregels voor Britse markt

De Britse financiële waakhond, de FCA, komt in 2026 met nieuwe regels speciaal voor crypto bedrijven. Wat direct opvalt: de toezichthouder laat enkele klassieke financiële verplichtingen los om beter aan te sluiten op de snelle en grillige wereld van digitale activa. Tegelijkertijd wordt er extra nadruk gelegd op digitale beveiliging,... Het bericht FCA komt in 2026 met aangepaste cryptoregels voor Britse markt verscheen het eerst op Blockchain Stories.
Share
Coinstats2025/09/18 00:33
Liquidity Boost Stabilizes Solana-Based Stablecoin USX After Market Drop

Liquidity Boost Stabilizes Solana-Based Stablecoin USX After Market Drop

Solana's USX stablecoin experiences a significant market drop due to liquidity issues. Solstice Finance intervenes to stabilize the value.Read more...
Share
Coinstats2025/12/27 12:51
Edges higher ahead of BoC-Fed policy outcome

Edges higher ahead of BoC-Fed policy outcome

The post Edges higher ahead of BoC-Fed policy outcome appeared on BitcoinEthereumNews.com. USD/CAD gains marginally to near 1.3760 ahead of monetary policy announcements by the Fed and the BoC. Both the Fed and the BoC are expected to lower interest rates. USD/CAD forms a Head and Shoulder chart pattern. The USD/CAD pair ticks up to near 1.3760 during the late European session on Wednesday. The Loonie pair gains marginally ahead of monetary policy outcomes by the Bank of Canada (BoC) and the Federal Reserve (Fed) during New York trading hours. Both the BoC and the Fed are expected to cut interest rates amid mounting labor market conditions in their respective economies. Inflationary pressures in the Canadian economy have cooled down, emerging as another reason behind the BoC’s dovish expectations. However, the Fed is expected to start the monetary-easing campaign despite the United States (US) inflation remaining higher. Investors will closely monitor press conferences from both Fed Chair Jerome Powell and BoC Governor Tiff Macklem to get cues about whether there will be more interest rate cuts in the remainder of the year. According to analysts from Barclays, the Fed’s latest median projections for interest rates are likely to call for three interest rate cuts by 2025. Ahead of the Fed’s monetary policy, the US Dollar Index (DXY), which tracks the Greenback’s value against six major currencies, holds onto Tuesday’s losses near 96.60. USD/CAD forms a Head and Shoulder chart pattern, which indicates a bearish reversal. The neckline of the above-mentioned chart pattern is plotted near 1.3715. The near-term trend of the pair remains bearish as it stays below the 20-day Exponential Moving Average (EMA), which trades around 1.3800. The 14-day Relative Strength Index (RSI) slides to near 40.00. A fresh bearish momentum would emerge if the RSI falls below that level. Going forward, the asset could slide towards the round level of…
Share
BitcoinEthereumNews2025/09/18 01:23