Market technician Patrick Karim shared a striking long-term chart this week with a simple message: “Crude Oil. Whatever happens on the Monday open is irrelevantMarket technician Patrick Karim shared a striking long-term chart this week with a simple message: “Crude Oil. Whatever happens on the Monday open is irrelevant

Oil Goes Where Silver Goes: Long-Term Chart Signals Higher Prices Ahead

2026/03/02 08:00
3 min read
For feedback or concerns regarding this content, please contact us at crypto.news@mexc.com

Market technician Patrick Karim shared a striking long-term chart this week with a simple message:

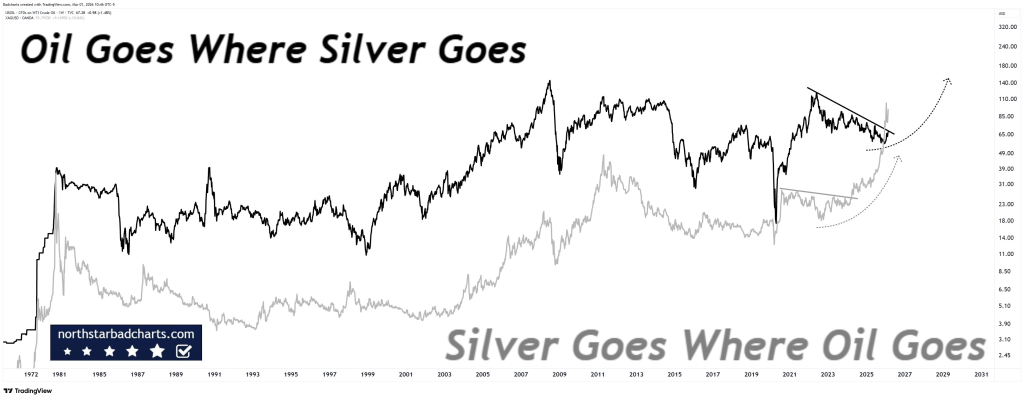
“Crude Oil. Whatever happens on the Monday open is irrelevant on the longer-term roadmaps. The pathway for higher prices for crude oil has been laid out by silver & gold.”

The chart compares decades of price action between crude oil and silver. One line tracks oil. The other tracks silver. The message is visual and blunt: major structural moves in silver tend to precede or align with large directional changes in oil.

This is about multi-year structure.

What the Long-Term Chart Is Showing

The chart stretches back to the 1970s. Across multiple cycles (inflation spikes, recessions, commodity booms, and crashes) oil and silver move in broad alignment during major macro phases.

When precious metals enter structural uptrends, oil often follows.

Right now, silver has already broken into a powerful bull phase. After consolidating for years, it exploded higher, printed new highs, corrected sharply, and is now rebuilding structure near key resistance. The longer-term pattern shows higher highs and higher lows across the macro timeframe.

Oil, by contrast, has been compressing.

Source: X/@badcharts1

On Karim’s chart, crude appears to be forming a large multi-year consolidation with a descending trendline capping recent rallies. Price has pulled back from prior highs but has not broken down structurally. It looks coiled.

There’s also a curved projection sketched on the right side of the chart. That projection mirrors silver’s prior breakout path and implies that oil could follow a similar expansion phase once resistance gives way.

The implication is clear: metals have already signaled the inflationary pressure. Oil may simply be lagging.

Read also: ChatGPT Predicts the Price of Silver and Gold If the U.S.–Iran War Escalates Further

Why Silver and Gold Could Be Leading

Precious metals tend to respond first to monetary instability, currency debasement fears, and geopolitical stress. They move when capital seeks protection.

Energy often reacts later, when inflation pressure feeds directly into supply chains and real-economy pricing.

Silver’s breakout above long-standing resistance indicates that liquidity conditions and inflation expectations are shifting. Gold has also remained structurally strong despite volatility in equities and crypto.

If metals are in the early phase of a broader commodity cycle, oil would not stay suppressed for long.

Karim’s point about the Monday open being irrelevant speaks to this idea. Short-term gaps driven by headlines do not change multi-year trend structure. Weekly and monthly charts define the real roadmap.

As long as crude oil holds its long-term support zones and continues compressing beneath that descending resistance, the setup resembles a classic coil before expansion.

A decisive breakout above that multi-year trendline would likely trigger momentum flows and repositioning across commodity markets.

If silver continues higher, Karim’s thesis indicates oil will not remain behind for long.

Read also: Strait of Hormuz Freeze: Oil Tankers Turn Back as War Risk Insurance Vanishes Overnight

Subscribe to our YouTube channel for daily crypto updates, market insights, and expert analysis.

The post Oil Goes Where Silver Goes: Long-Term Chart Signals Higher Prices Ahead appeared first on CaptainAltcoin.

Market Opportunity
Belong Logo
Belong Price(LONG)
$0.002055
$0.002055$0.002055
+0.53%
USD
Belong (LONG) Live Price Chart
Disclaimer: The articles reposted on this site are sourced from public platforms and are provided for informational purposes only. They do not necessarily reflect the views of MEXC. All rights remain with the original authors. If you believe any content infringes on third-party rights, please contact crypto.news@mexc.com for removal. MEXC makes no guarantees regarding the accuracy, completeness, or timeliness of the content and is not responsible for any actions taken based on the information provided. The content does not constitute financial, legal, or other professional advice, nor should it be considered a recommendation or endorsement by MEXC.
Tags:

You May Also Like

Polygon Tops RWA Rankings With $1.1B in Tokenized Assets

Polygon Tops RWA Rankings With $1.1B in Tokenized Assets

The post Polygon Tops RWA Rankings With $1.1B in Tokenized Assets appeared on BitcoinEthereumNews.com. Key Notes A new report from Dune and RWA.xyz highlights Polygon’s role in the growing RWA sector. Polygon PoS currently holds $1.13 billion in RWA Total Value Locked (TVL) across 269 assets. The network holds a 62% market share of tokenized global bonds, driven by European money market funds. The Polygon POL $0.25 24h volatility: 1.4% Market cap: $2.64 B Vol. 24h: $106.17 M network is securing a significant position in the rapidly growing tokenization space, now holding over $1.13 billion in total value locked (TVL) from Real World Assets (RWAs). This development comes as the network continues to evolve, recently deploying its major “Rio” upgrade on the Amoy testnet to enhance future scaling capabilities. This information comes from a new joint report on the state of the RWA market published on Sept. 17 by blockchain analytics firm Dune and data platform RWA.xyz. The focus on RWAs is intensifying across the industry, coinciding with events like the ongoing Real-World Asset Summit in New York. Sandeep Nailwal, CEO of the Polygon Foundation, highlighted the findings via a post on X, noting that the TVL is spread across 269 assets and 2,900 holders on the Polygon PoS chain. The Dune and https://t.co/W6WSFlHoQF report on RWA is out and it shows that RWA is happening on Polygon. Here are a few highlights: – Leading in Global Bonds: Polygon holds 62% share of tokenized global bonds (driven by Spiko’s euro MMF and Cashlink euro issues) – Spiko U.S.… — Sandeep | CEO, Polygon Foundation (※,※) (@sandeepnailwal) September 17, 2025 Key Trends From the 2025 RWA Report The joint publication, titled “RWA REPORT 2025,” offers a comprehensive look into the tokenized asset landscape, which it states has grown 224% since the start of 2024. The report identifies several key trends driving this expansion. According to…
Share
BitcoinEthereumNews2025/09/18 00:40
Shiba Inu (SHIB) Price Reset Point: Three Oversold Indicators, 20% Potential

Shiba Inu (SHIB) Price Reset Point: Three Oversold Indicators, 20% Potential

The post Shiba Inu (SHIB) Price Reset Point: Three Oversold Indicators, 20% Potential appeared on BitcoinEthereumNews.com. Shiba Inu remains lower Most likely outcome
Share
BitcoinEthereumNews2026/03/02 22:49
MAXI DOGE Holders Diversify into $GGs for Fast-Growth 2025 Crypto Presale Opportunities

MAXI DOGE Holders Diversify into $GGs for Fast-Growth 2025 Crypto Presale Opportunities

Presale crypto tokens have become some of the most active areas in Web3, offering early access to projects that blend culture, finance, and technology. Investors are constantly searching for the best crypto presale to buy right now, comparing new token presales across different niches. MAXI DOGE has gained attention for its meme-driven energy, but early [...] The post MAXI DOGE Holders Diversify into $GGs for Fast-Growth 2025 Crypto Presale Opportunities appeared first on Blockonomi.
Share
Blockonomi2025/09/18 00:00