

Solana (SOL) Price: Breaks Bearish Structure as ETF Inflows Return After Two-Week Drought
TLDR
- Solana is trading at $85 after breaking a local bearish trend pattern that had controlled price movement for much of the week
- US-listed spot SOL ETFs recorded inflows of $13.17 million last week, ending a two-week outflow streak that began in late January
- The $95 resistance level is the next upside target if bullish momentum continues
- Solana’s futures funding rates stayed negative for 16 consecutive days, the longest streak in years
- Goldman Sachs disclosed $108 million in SOL holdings while Solana’s Real World Asset TVL reached an all-time high of $1.66 billion
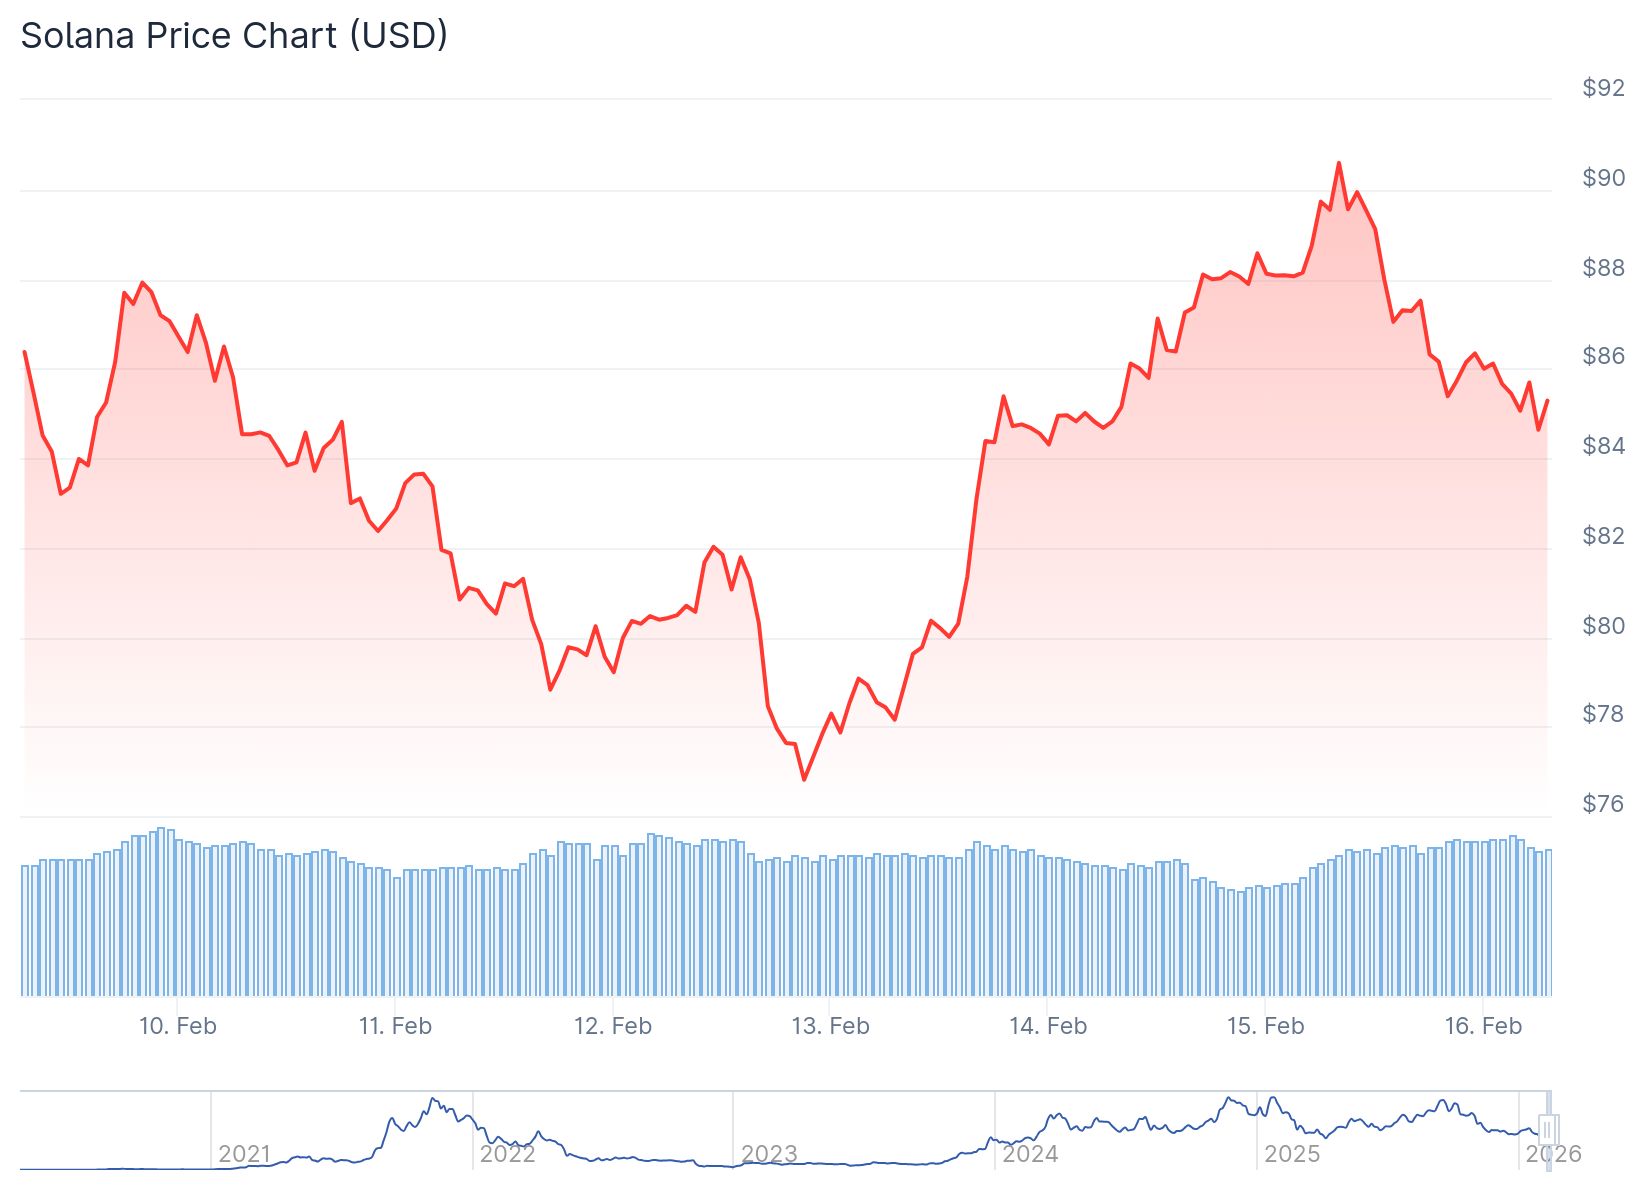
Solana is currently trading at $85 after showing signs of a technical reversal. The cryptocurrency has broken its short-term bearish market structure, which could signal a shift in momentum.
 Solana (SOL) Price
The recent price movement comes after Solana found support near $76.45 last Thursday. Over the following two days, SOL recovered to reach $89.38 before pulling back. The cryptocurrency now trades between these two levels as it attempts to establish a new direction.
Institutional money is flowing back into Solana products. Spot ETFs saw $13.17 million in inflows last week. This marks the first positive week after two consecutive weeks of outflows that started at the end of January.
The technical picture shows improving conditions. The Relative Strength Index on the daily chart reads 35, bouncing back from oversold territory. This indicates that selling pressure is easing. The Moving Average Convergence Divergence indicator showed a bullish crossover on Sunday.
Market structure analysis reveals that Solana has printed a new high after an extended period of lower highs and lower lows. This breakout invalidates the immediate bearish trend. Short-term momentum has shifted back in favor of buyers.
Key Technical Levels
The $95 level represents the next major resistance area. This is where price previously faced rejection. A move to this level would place Solana back into the upper portion of its broader trading range.
On the downside, holding above the value area low remains critical. This level represents the lower boundary of fair value within the current range. As long as price stays above this support, Solana can establish a higher low pattern.
If SOL closes below $76.45, it could extend losses toward $67.50. That level marked the February 6 low.
Institutional Activity Increases
Major financial institutions are taking positions in Solana. Goldman Sachs disclosed holdings worth $108 million in SOL. Citi has also engaged with the network, representing a bill of exchange as a token and executing its entire lifecycle on the Solana blockchain.
Solana’s Real World Asset Total Value Locked climbed to a record $1.66 billion. The platform now has over 285,000 unique holders in this category.
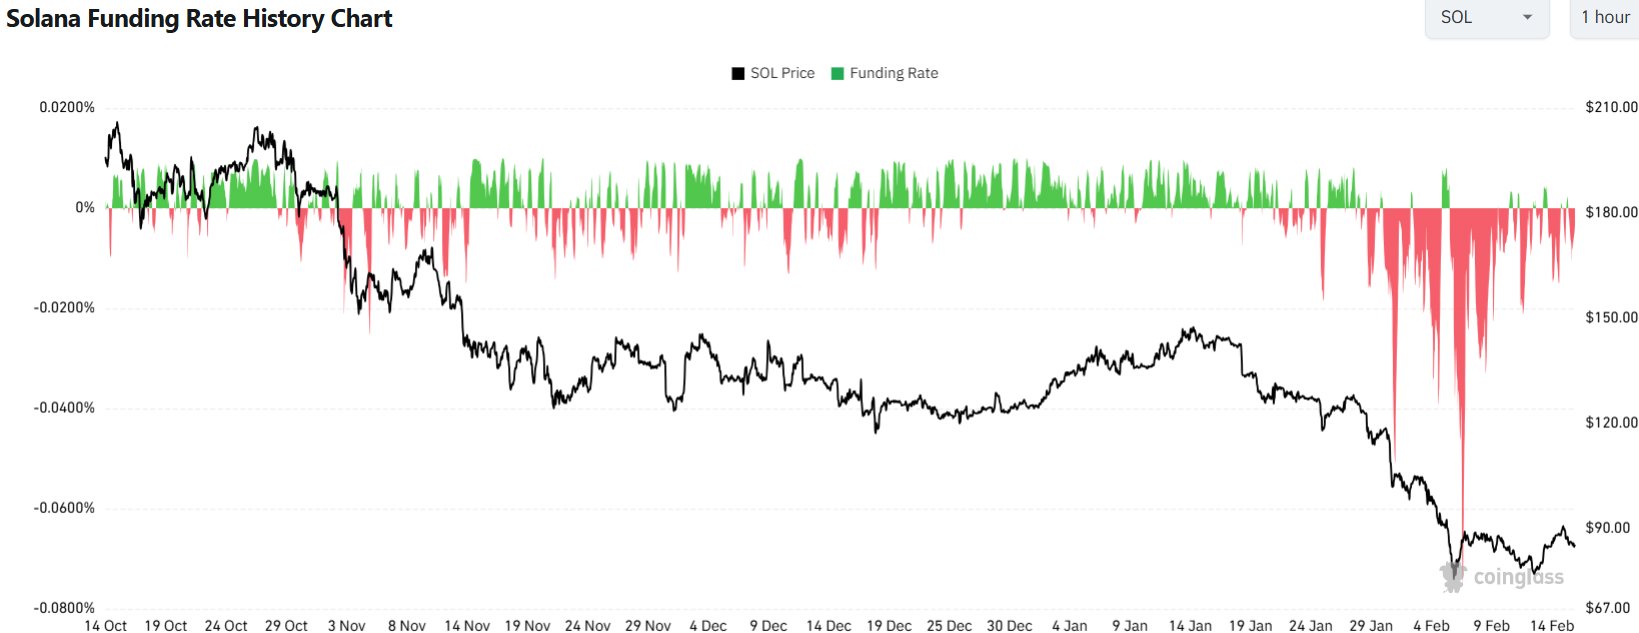
The derivatives market shows unusual positioning. Funding rates stayed negative for 16 straight days. This metric reflects that short positions paid longs to hold exposure. The current reading sits near minus 0.0042.
 Source: Coinglass
Extended negative funding has appeared only twice before in Solana’s history. Those instances occurred in November 2022 when SOL traded near $8 and in September 2023 when it hovered around $20.
When shorts dominate for extended periods, forced covering can occur during rebounds. This can amplify short-term price movements. However, funding rates alone do not determine trend direction.
Volume expanded during recent price movements. The $80 zone has attracted buying interest, with recent candles showing longer lower wicks at this level. Price has not yet reclaimed the former range that held through much of 2024 and 2025.
Solana trades at $85 on Monday after testing both the upper and lower boundaries of its consolidation zone over the past week.
The post Solana (SOL) Price: Breaks Bearish Structure as ETF Inflows Return After Two-Week Drought appeared first on CoinCentral.
You May Also Like
Top 3 Cheap Cryptocurrencies With 700% Upside Potential

Web3 Rises as Pi Network Accelerates Its Decentralized Vision for the Future of Crypto
The global digital economy is undergoing a structural transformation. As centralized platforms face growing scrutiny over con
