

Bitcoin Sell-Off Eases as Institutional Buying Emerges: Is a BTC Price Rally On the Cards?

The post Bitcoin Sell-Off Eases as Institutional Buying Emerges: Is a BTC Price Rally On the Cards? appeared first on Coinpedia Fintech News
Bitcoin’s recent sell-off appears to be losing momentum as signs of institutional buying begin to surface across the market. After weeks of sustained downside pressure, selling intensity has moderated, and price action is showing early signs of stabilisation near key support levels.
At the same time, market data points to large investors quietly building positions at lower prices, even as overall sentiment remains cautious. While it is still too early to call a full trend reversal, the change in market behavior has raised an important question: Is Bitcoin (BTC) price setting the stage for a short-term recovery, or simply taking a breather before its next move?
Institutional Accumulation Begins to Pick Up
The chart shows a clear pickup in Bitcoin inflows to accumulation addresses over the past few weeks. After spending much of the recent correction near relatively muted levels, daily inflows have surged sharply, with several spikes moving above 15,000 BTC, and recent peaks approaching the 20,000 BTC mark.
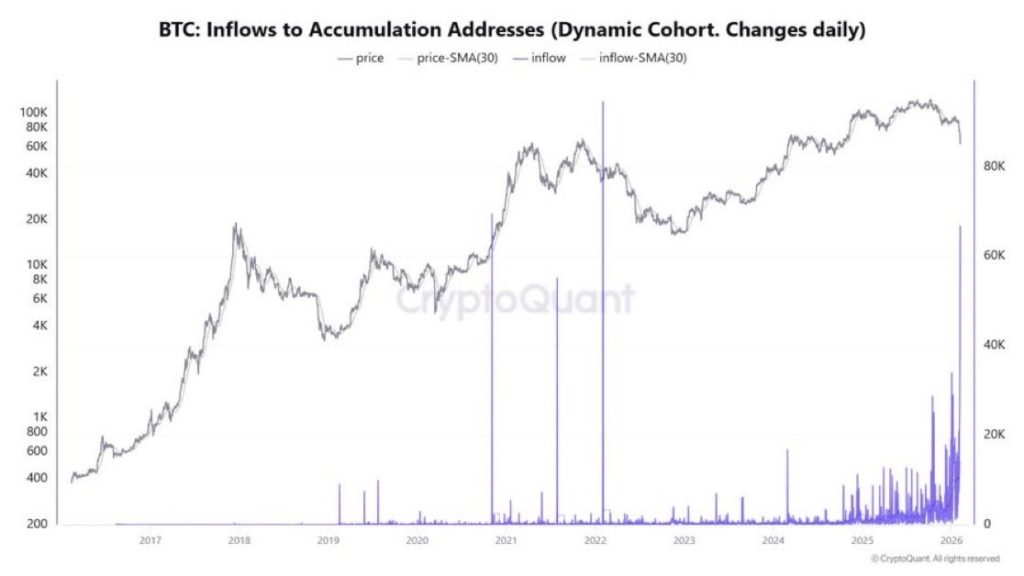
What’s notable is that this rise in accumulation is happening while Bitcoin’s price remains well below recent highs. Historically, similar bursts of inflows have tended to appear when selling pressure starts to ease and long-term investors step in during periods of uncertainty. While this doesn’t guarantee an immediate rebound, it does suggest that larger players are becoming more active at current levels.
That said, accumulation alone is not a confirmation signal. For Bitcoin to transition into a sustained recovery, these elevated inflows would need to persist and be accompanied by an improving price structure and follow-through demand across the market.
Has Whale Accumulation Impacted Price Action?
Despite the recent increase in whale and long-term holder accumulation, Bitcoin’s price response has so far remained muted and structurally weak.
On the daily chart, BTC is trading around $69,300, sitting just above the 0.236 Fibonacci retracement at $69,014, which has acted as short-term support following the sharp sell-off. The bounce from the recent low near $60,074 (0 Fib) shows that buyers did step in aggressively, but follow-through has been limited.
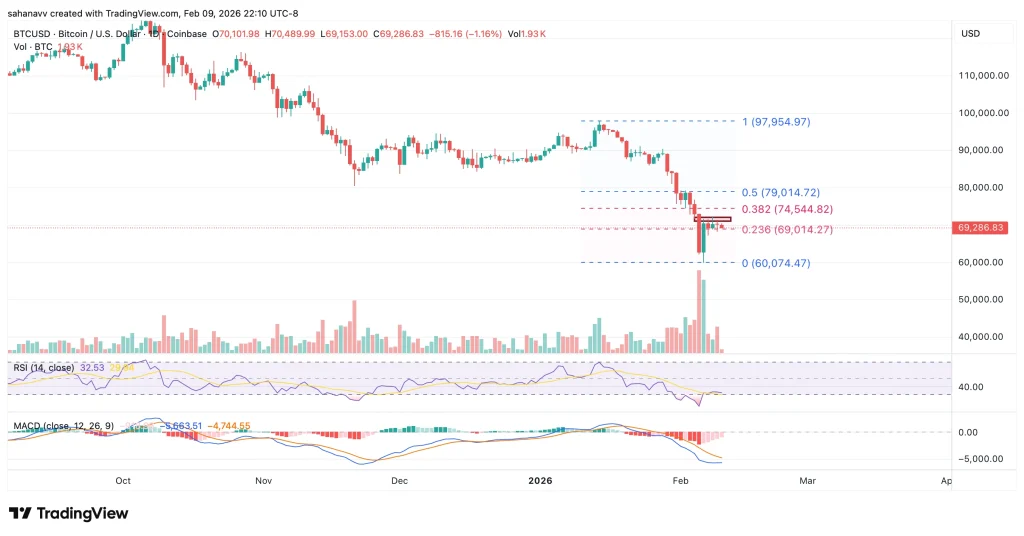
The RSI is hovering around 32–34, still in bearish territory and only marginally recovering from oversold conditions. Besides, MACD remains deeply negative, with the histogram expanding to the downside, indicating that downside momentum has slowed but has not yet reversed. This suggests that while whale accumulation may have helped establish a temporary price floor near $60K, it has not yet translated into sustained upside momentum.
Key Levels to Watch Next
For accumulation to meaningfully impact price action, Bitcoin needs to reclaim higher technical levels:
- Immediate resistance: $74,500–$75,000- A daily close above this zone would signal improving short-term structure and confirm that buyers are gaining control.
- Bullish confirmation zone: $79,000–$80,000- A move into this range would indicate that the recent sell-off was corrective rather than the start of a deeper downtrend.
- Downside risk: Failure to hold $69,000 increases the risk of a retest of the $60,000–$62,000 demand zone, where the strongest buying response was last seen.
Conclusion: What Traders Need to Watch?
Whale accumulation appears to be absorbing downside pressure, but Bitcoin’s price action still points to consolidation rather than a confirmed reversal. After rebounding from the $60,000–$62,000 zone, BTC is holding near $69,000, suggesting sellers have slowed but buyers have yet to take control.
As long as the Bitcoin (BTC) price remains below $74,500, upside moves are likely to stay corrective. A break above this level would improve the outlook and open room toward $79,000–$80,000, while a loss of $69,000 would put the $60,000–$62,000support area back in focus.


You May Also Like

Kraken nears UAE launch after Dubai VARA approval

The Crypto Industry Has a Trust Problem And It’s Not Going Away
AMD commits $10B to Taiwan's semiconductor chip packaging, manufacturing ecosystem


