Bitcoin Teeters Between CME Gaps and New Macro Lows: Analysis

Bitcoin failed to sustain a move above $69,000 as markets opened the weekend with caution, mirroring a broader hesitancy among traders about chasing new highs amid an uncertain macro backdrop. Fresh downside risk was baked into price action as BTC slipped more than $4,000 from the daily open, signaling that the rebound into the weekend may have been a relief rally rather than a durable trend reversal. Analysts point to resistance just below or at the old 2021 all-time high, around $69,000, which is seen as a formidable barrier. Meanwhile, two CME futures gaps loom on the horizon, offering potential magnets for price if demand accelerates again.
Key points:
-
Bitcoin faces a lack of acceptance above $69,000, while traders see new lows to come.
-
Analysis says that the rebound into the weekend was nothing more than a “relief rally.”
-
Two CME futures gaps provide potential targets for BTC price upside.
BTC price bottom “not in,” analysis warns
Data from TradingView showed BTC price action dropping more than $4,000 versus the daily open. With the old 2021 all-time high increasingly turning to resistance, cautious traders rejected the notion of a quick revival. The immediate takeaway among several market observers was that the weekend rally looked more like a relief bounce than a sustainable bottom formation.
BTC/USD one-hour chart. Source: Cointelegraph/TradingView“TLDR: The bottom for BTC is not in. My priority right now is capital preservation,” said Keith Alan, cofounder of trading resource Material Indicators, in a post on X the day before the latest price action. His warning captured a broader mood among traders who view the market as exposed to further downside risk before any durable upward momentum could reassert itself. A separate blockquote captured his sentiment: “If you’re thinking, ‘We’re so back,’ we’re not. There is literally no evidence of that yet.”
Alan also highlighted the significance of the 2021 peak around $69,000, describing it as an “important” level within what he characterized as an ongoing relief rally. He added that the recent move was “a gift yesterday,” but warned that lower prices may come before a renewed bull-market cycle could take hold.
Zooming out, market analyst Rekt Capital also argued that the most pronounced downside pressure may still be ahead. In a post on X, he likened BTC/USD’s behavior to the late-2022 bear market, suggesting that a recurring historical pattern—where a fourth consecutive cycle echoes a familiar base formation—points to further weakness before a potential bottom is established. “This is the 4th consecutive cycle that this historical tendency has continued. And history suggests there’s more downside to come,” he wrote, underscoring the stubborn risk that BTC could test lower support before a broader recovery materializes.
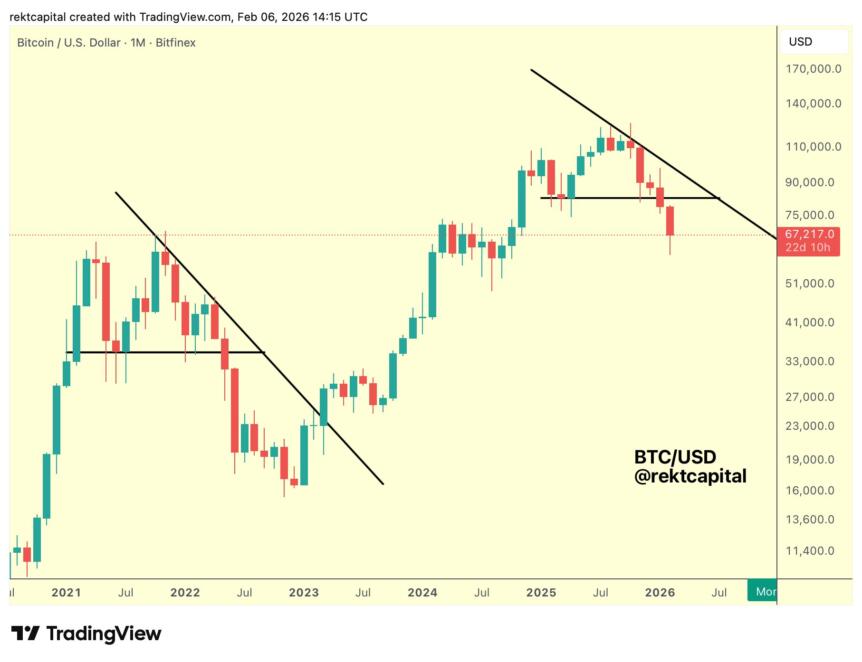 BTC/USD one-month chart. Source: Rekt Capital/X
Bitcoin bulls bet on CME gap fills
Saturday’s retracement, meanwhile, left a new potential “gap” in CME Group’s Bitcoin futures market. This development has kept a subset of traders focused on classic short-term price magnets, with the market watching two CME gaps that could act as catalysts if prices rally in the near term.
Related: Bitcoin beats FTX, COVID-19 crash with record dive below 200-day trend line
A short-term magnet narrative has re-emerged, centered on a gap near $84,000 and a separate level that could pull prices higher if demand re-emerges. Traders argued that such gaps often attract price action as liquidity cycles through the market, even if the longer-term trend remains uncertain. The chatter around CME gaps aligns with a broader view that a relief rally could redraw price trajectories in the near term, though it is not a guarantee of a lasting bounce.
In parallel, traders like Michaël van de Poppe, a veteran analyst and founder of various crypto ventures, voiced a more constructive near-term view. He forecast a continuation pattern where a correction gives way to a move toward the CME gap and beyond, suggesting that the next week could carry BTC toward the $75,000-and-higher zone if momentum reasserts. “Today: correction day. Tomorrow: back up again towards the CME gap. Next week: continuation to $75k+,” he wrote in a post on X, signaling that the possibility of a rebound is not dismissed by some observers.
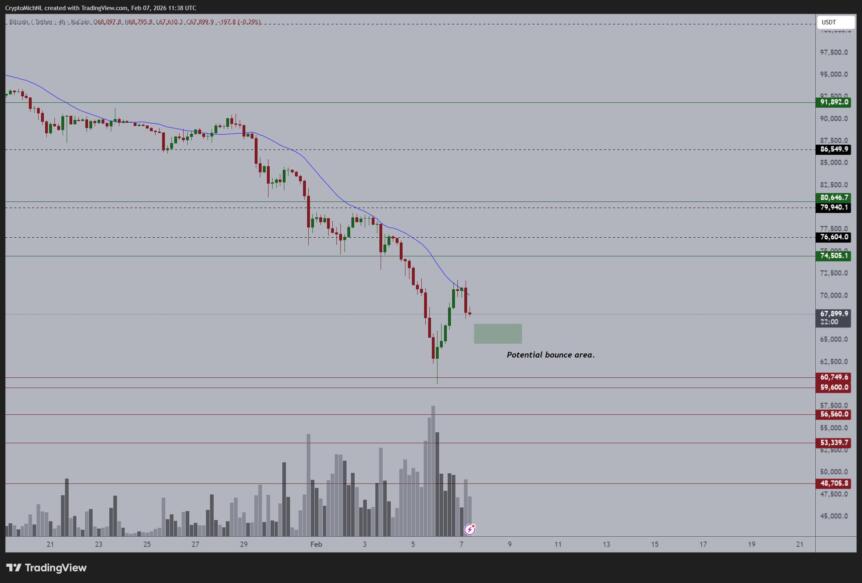 BTC/USDT four-hour chart. Source: Michaël van de Poppe/X
Notably, Samson Mow, CEO of Bitcoin-adoption firm JAN3, framed the event as a test of whether large-scale corporate buyers will step in to buy BTC at the new price levels. He described the higher CME gap as one of two questions every financial analyst should be asking: whether institutional demand can absorb the selling pressure given the 15-month low in BTC prices, and whether corporate treasury activity will pick up as prices drift lower. “I believe the answers are not for long and very soon,” he concluded in a post on X, signaling that the near term could reveal significant shifts in demand just as price action wobbles around key levels.
//platform.twitter.com/widgets.js
Why it matters
The present price action matters because it tests the resilience of BTC’s uptrend hypothesis at a time when macro uncertainties linger. A failure to sustain moves beyond critical resistance around $69,000 reinforces the notion that the market is wrestling with a structural pivot rather than a short-lived surge. The CME gaps add a practical, price-target dimension to the debate: if price finds buyers near those gaps, it could spur a corrective rally that lasts into the following week; if not, the risk-off mood may extend and push BTC toward the lower end of recent ranges.
Moreover, the discourse around corporate treasury demand—an ongoing theme in crypto markets—could shape the supply/demand balance in the months ahead. If large buyers re-enter at these levels, they could provide a floor that mitigates downside risk and sets the stage for a broader recovery. Conversely, persistent macro weak spots or a fresh risk-off impulse could keep BTC mired in a corrective phase, testing support levels that traders have watched since late 2025.
Taken together, the footage from trading desks shows a market that remains finely poised between a cautious, risk-averse stance and a renewed appetite for risk-taking when specific technical benchmarks align with liquidity drivers. The result is a price story that is less about a single breakout and more about the tug of war between macro-impacted liquidity and market structure signals like CME gaps and key resistance levels.
What to watch next
- Watch how BTC trades around the CME gap near $84,000 in the coming days and whether price action tests that area again.
- Monitor whether buyers reappear near the mid-to-upper $70k region, potentially signaling a shift in the short-term trend.
- Look for any signs of renewed institutional or corporate BTC treasury activity as prices approach critical levels.
- Assess macro cues and liquidity conditions, since they likely will continue shaping volatility and the pace of any potential relief rallies.
Sources & verification
- TradingView BTCUSD price data referenced in the price action discussion.
- Comments from Keith Alan (Material Indicators) on BTC’s bottom and capital preservation, shared on X.
- Analysis from Rekt Capital regarding cycle patterns and potential downside in BTC/USD.
- Forecasts from Michaël van de Poppe on CME gaps and near-term targets.
- Remarks from Samson Mow on corporate BTC treasury activity and near-term demand dynamics.
What the market is watching next
The coming days will be telling for BTC’s near-term orientation. If the price can reclaim and sustain a move above the $75,000–$80,000 range and, more broadly, approach the CME gap around $84,000, bulls may gain a foothold that could catalyze a more substantive rebound. Conversely, if selling pressure intensifies and price breaks back toward the mid-$60,000s, the market could extend the current corrective phase while traders reassess whether a longer bear-market cycle has run its course. As always, liquidity, macro risk sentiment, and institutional participation will remain the key variables shaping outcomes in the weeks ahead.
You May Also Like

Critical Update: Netanyahu Reveals No Timeline for Ending War with Iran as U.S. Prioritizes Uranium and Strait

Dogecoin and Hyperliquid Are Heating Up — But This New Project Might Be the One to Watch