

Solana Price Reclaims $85, but On-Chain Data Tells a More Cautious Story
The post Solana Price Reclaims $85, but On-Chain Data Tells a More Cautious Story appeared first on Coinpedia Fintech News
Crypto markets witnessed a mild recovery today after last week’s sharp sell-off, with Bitcoin stabilizing and altcoins attempting to form short-term bases. Solana joined the rebound, climbing over 5% to reclaim the $85 level after briefly dipping into the low-$70s. The move has eased immediate downside pressure, but on-chain data suggests the market is still recalibrating rather than transitioning into a fresh uptrend. While SOL price has bounced, the deeper market signals point to balance returning, not conviction. The question now centers on whether Solana (SOL) is building a foundation or merely reacting to exhausted selling.
Solana’s On-Chain Data Reflects Cooling Conditions After the Sell-Off
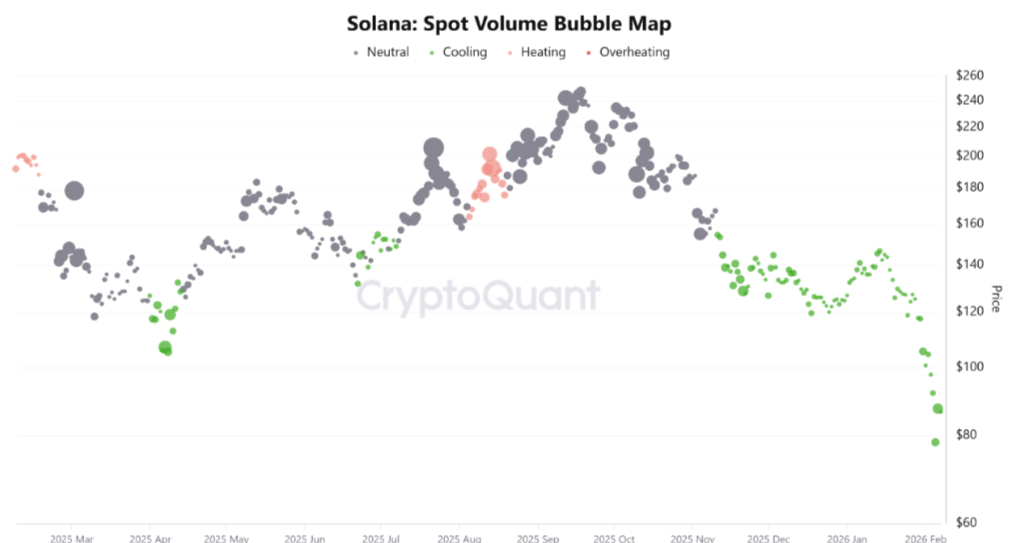
Solana’s on-chain data reflects a textbook post-liquidation environment. CryptoQuant’s Spot Volume Bubble Map places current activity firmly in a “cooling” region, a phase typically observed after extended declines. Historically, this zone indicates that sellers have largely exited, but buyers have not yet re-engaged with force. Crucially, spot volume remains subdued relative to prior recovery attempts. This matters because sustainable bottoms are usually accompanied by rising spot participation, not just price stabilization. The absence of strong spot inflows suggests that large holders are waiting for confirmation rather than front-running a reversal.
Derivatives data reinforces this view. Futures volume bubble maps show a sharp transition from “overheating” to “cooling,” confirming that speculative leverage has been flushed. Open interest has contracted meaningfully, reducing liquidation risk but also signaling reduced directional conviction. In simple terms, traders have stepped back rather than stepped in.
Stablecoin Inflows Rise as Traders Stay Cautious
Stablecoin flow data adds an important layer to the narrative. Exchange inflows of USDT recently spiked to multi-week highs, reflecting fresh liquidity entering the system. However, this liquidity has not translated into aggressive Solana accumulation.
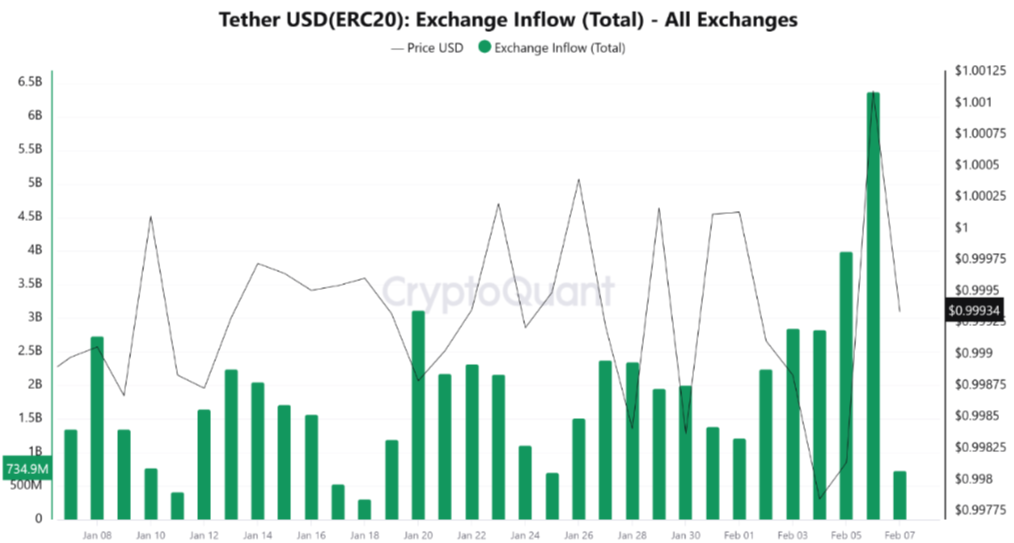
Historically, strong bottoms form when rising stablecoin balances coincide with expanding spot volume and declining exchange reserves for the asset itself. At present, Solana’s on-chain footprint shows liquidity availability without decisive allocation. This asymmetry suggests capital is positioning defensively, waiting for clearer signals before committing. In institutional terms, the market is liquid but cautious.
Solana Price Reclaims $85, but Key Resistance Still Overhead
Solana’s price rebound toward the $85 mark marks a clear short-term recovery from recent panic lows, but the broader chart structure suggests the move is still corrective rather than trend-changing. On the daily timeframe, SOL remains confined within a descending channel that has guided price action since the January breakdown, indicating that sellers continue to control the dominant trend. The recent bounce originated from a well-defined demand zone in the $70–$75 region, where historical buying interest previously absorbed heavy sell pressure. That zone acted as a liquidity flush, triggering short covering and a technical rebound. However, the rally has so far stalled near the mid-range of the descending channel, an area that has repeatedly capped upside attempts over the past several weeks.
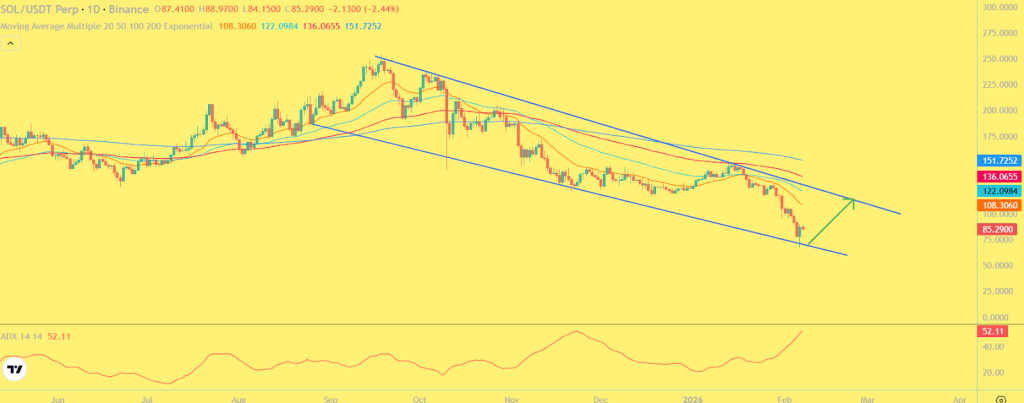
The $88–$92 resistance band now stands out as the first major supply zone. This region aligns with prior breakdown levels, short-term moving averages, and the upper boundary of the declining structure. A clean daily close above this zone would be required to shift market structure and open the door toward $100. Until then, upside moves risk being sold into. On the downside, immediate support now rests near $80, followed by the broader demand block around $72. As long as SOL holds above $80, the rebound structure remains intact. A failure back below that level would signal that the current move is losing momentum and could drag price back toward the lower demand area. Overall, Solana’s price action reflects stabilization after a sharp sell-off, but confirmation of a trend reversal remains absent.
Final Thoughts
Solana’s price recovery toward $85 reflects short-term relief driven by oversold conditions and cooling on-chain metrics, including declining futures leverage and stabilizing spot volume. That said, exchange inflows and muted follow-through buying suggest conviction is still building. A sustained push above the $90–$95 resistance zone, backed by rising spot demand and reduced sell pressure, is needed to confirm a durable trend shift rather than a temporary rebound.


You May Also Like

PMI-ACP Exam Preparation: How to Use a Simulator and Practice Questions Effectively

What a $900 Investment in New Crypto Protocols Could Become by Late 2027


