TLDR Bitcoin’s four-year cycle pattern continues to follow historical trends Current market conditions mirror past post-halving consolidation periods Long sidewaysTLDR Bitcoin’s four-year cycle pattern continues to follow historical trends Current market conditions mirror past post-halving consolidation periods Long sideways

Bitcoin Cycle Still Alive: Why “This Time Is Different” May Be Wrong Says Top Analyst

2026/02/07 16:23
3 min read

TLDR

  • Bitcoin’s four-year cycle pattern continues to follow historical trends
  • Current market conditions mirror past post-halving consolidation periods
  • Long sideways price movements are normal before major rallies begin
  • Institutional involvement hasn’t changed underlying cycle psychology
  • Higher lows continue forming despite flat short-term price action

Bitcoin continues to move through its established four-year cycle pattern. Despite growing voices claiming the cryptocurrency has outgrown its historical behavior, market data shows otherwise.

The current market phase mirrors previous post-halving periods. Each cycle has included extended periods of sideways price movement before major rallies began. This pattern has repeated multiple times over Bitcoin’s history.

Market participants often struggle during consolidation phases. When prices stall and momentum fades, many investors lose confidence in the cycle framework. However, past data shows these quiet periods typically preceded explosive price moves.

The “this time is different” narrative appears in every cycle. Doubters point to new market conditions or changed circumstances as reasons why historical patterns won’t repeat. Yet the same forces that drove earlier cycles remain in play.

Timing and Market Structure

Bitcoin’s strongest rallies have occurred well after halving events. The lag time between halvings and price surges creates impatience among traders. This waiting period shakes out investors who expected immediate results.
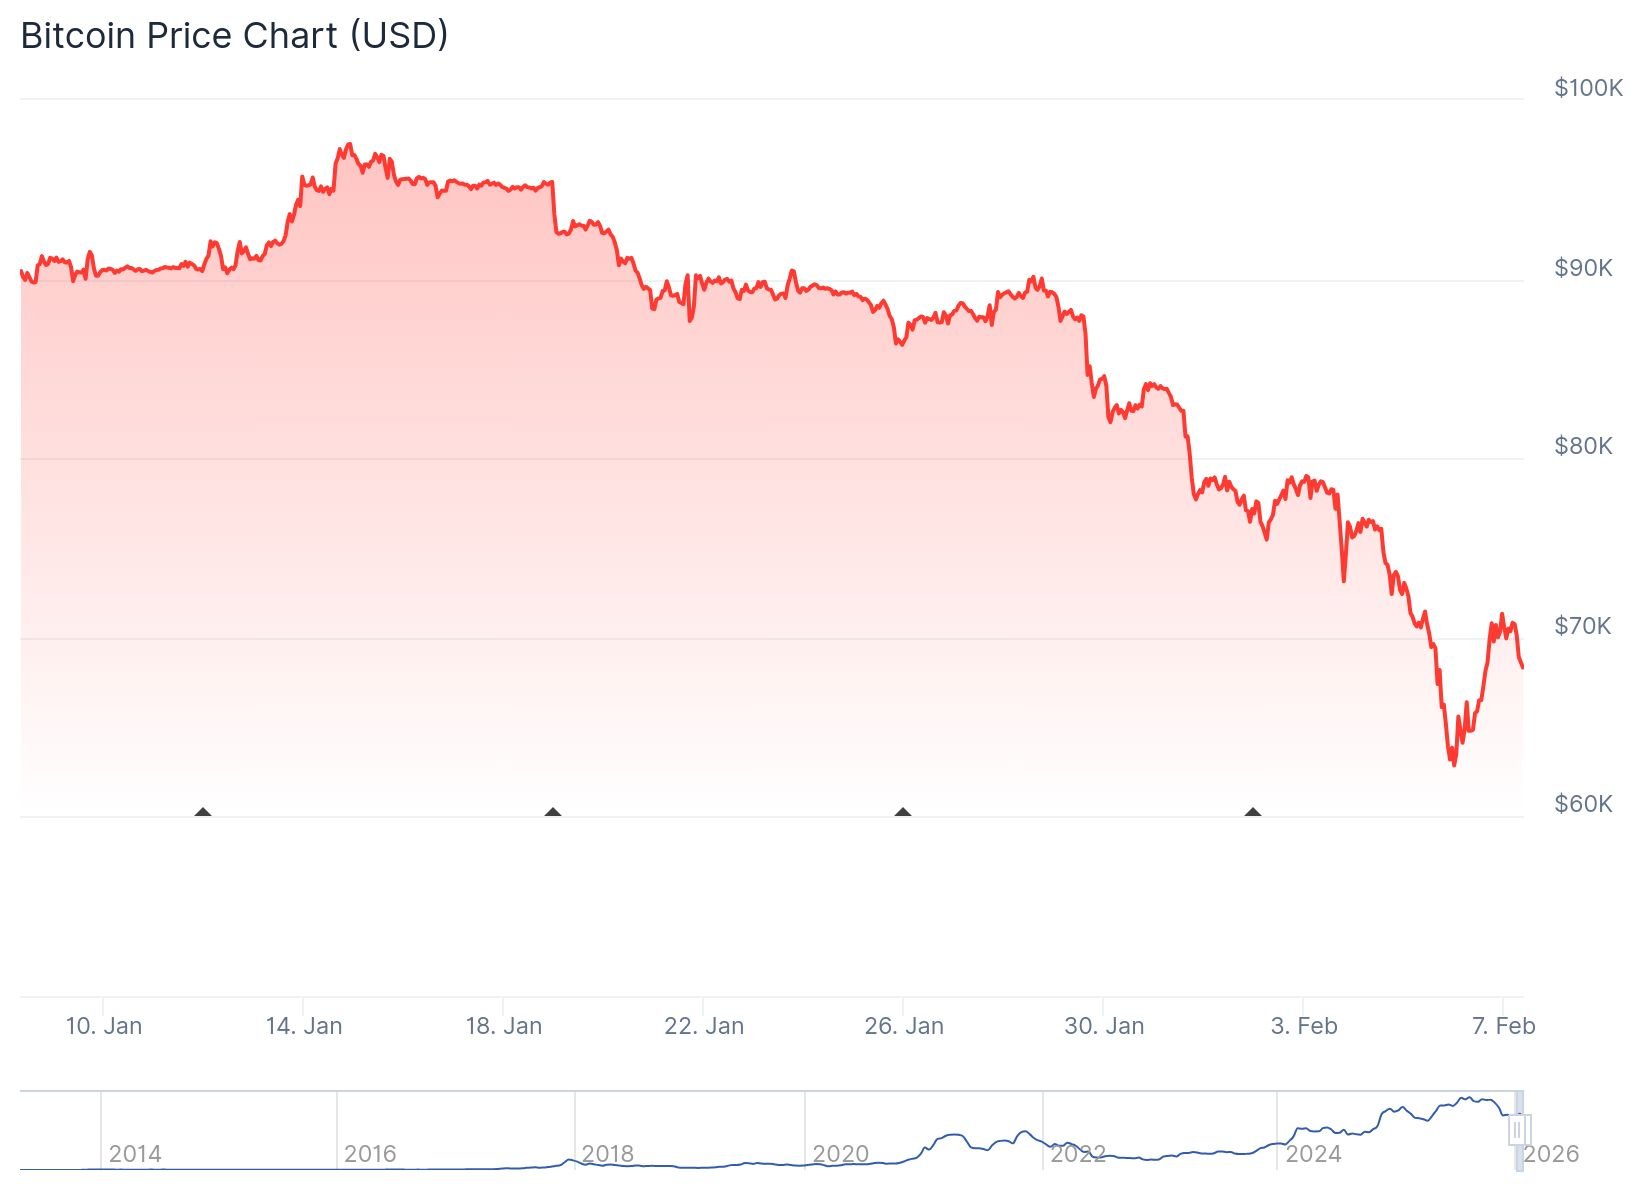
Bitcoin (BTC) PriceBitcoin (BTC) Price

Long-term trend indicators continue showing higher lows forming over time. While daily or weekly price action may disappoint, the broader structure remains intact. This divergence between sentiment and structure has appeared in previous cycles.

Institutional participation has changed some market mechanics. Bitcoin ETFs and larger players have entered the space in recent years. However, these changes haven’t eliminated human psychology from trading decisions.

Fear and greed still dominate market behavior. Impatience during consolidation phases remains common regardless of who holds the assets. These emotional forces continue shaping cycle patterns as they did in earlier years.

Consolidation and Volatility

Price ranges have tightened during the current phase. As volatility compresses, attention naturally drifts away from Bitcoin. Past cycles show these quiet periods often ended abruptly.

Both bullish and bearish traders have been caught off guard by sudden moves. Compressed ranges historically preceded breakouts in either direction. The current consolidation fits this historical template.

Market expectations often anchor to recent price action. When Bitcoin fails to move higher quickly, bearish narratives gain traction. This sentiment shift has occurred during every major cycle’s consolidation phase.

The video presentation focused on probability rather than specific predictions. Cycles don’t repeat exactly but tend to rhyme. Understanding historical context provides more value than reacting to short-term uncertainty.

Bitcoin’s current behavior doesn’t require new explanations. The same cycle dynamics from previous years continue playing out today.

The post Bitcoin Cycle Still Alive: Why “This Time Is Different” May Be Wrong Says Top Analyst appeared first on CoinCentral.

Market Opportunity
Major Logo
Major Price(MAJOR)
$0.08614
$0.08614$0.08614
-1.44%
USD
Major (MAJOR) Live Price Chart
Disclaimer: The articles reposted on this site are sourced from public platforms and are provided for informational purposes only. They do not necessarily reflect the views of MEXC. All rights remain with the original authors. If you believe any content infringes on third-party rights, please contact service@support.mexc.com for removal. MEXC makes no guarantees regarding the accuracy, completeness, or timeliness of the content and is not responsible for any actions taken based on the information provided. The content does not constitute financial, legal, or other professional advice, nor should it be considered a recommendation or endorsement by MEXC.
Tags:

You May Also Like

CME Group to Launch Solana and XRP Futures Options

CME Group to Launch Solana and XRP Futures Options

The post CME Group to Launch Solana and XRP Futures Options appeared on BitcoinEthereumNews.com. An announcement was made by CME Group, the largest derivatives exchanger worldwide, revealed that it would introduce options for Solana and XRP futures. It is the latest addition to CME crypto derivatives as institutions and retail investors increase their demand for Solana and XRP. CME Expands Crypto Offerings With Solana and XRP Options Launch According to a press release, the launch is scheduled for October 13, 2025, pending regulatory approval. The new products will allow traders to access options on Solana, Micro Solana, XRP, and Micro XRP futures. Expiries will be offered on business days on a monthly, and quarterly basis to provide more flexibility to market players. CME Group said the contracts are designed to meet demand from institutions, hedge funds, and active retail traders. According to Giovanni Vicioso, the launch reflects high liquidity in Solana and XRP futures. Vicioso is the Global Head of Cryptocurrency Products for the CME Group. He noted that the new contracts will provide additional tools for risk management and exposure strategies. Recently, CME XRP futures registered record open interest amid ETF approval optimism, reinforcing confidence in contract demand. Cumberland, one of the leading liquidity providers, welcomed the development and said it highlights the shift beyond Bitcoin and Ethereum. FalconX, another trading firm, added that rising digital asset treasuries are increasing the need for hedging tools on alternative tokens like Solana and XRP. High Record Trading Volumes Demand Solana and XRP Futures Solana futures and XRP continue to gain popularity since their launch earlier this year. According to CME official records, many have bought and sold more than 540,000 Solana futures contracts since March. A value that amounts to over $22 billion dollars. Solana contracts hit a record 9,000 contracts in August, worth $437 million. Open interest also set a record at 12,500 contracts.…
Share
BitcoinEthereumNews2025/09/18 01:39
Microsoft Corp. $MSFT blue box area offers a buying opportunity

Microsoft Corp. $MSFT blue box area offers a buying opportunity

The post Microsoft Corp. $MSFT blue box area offers a buying opportunity appeared on BitcoinEthereumNews.com. In today’s article, we’ll examine the recent performance of Microsoft Corp. ($MSFT) through the lens of Elliott Wave Theory. We’ll review how the rally from the April 07, 2025 low unfolded as a 5-wave impulse followed by a 3-swing correction (ABC) and discuss our forecast for the next move. Let’s dive into the structure and expectations for this stock. Five wave impulse structure + ABC + WXY correction $MSFT 8H Elliott Wave chart 9.04.2025 In the 8-hour Elliott Wave count from Sep 04, 2025, we saw that $MSFT completed a 5-wave impulsive cycle at red III. As expected, this initial wave prompted a pullback. We anticipated this pullback to unfold in 3 swings and find buyers in the equal legs area between $497.02 and $471.06 This setup aligns with a typical Elliott Wave correction pattern (ABC), in which the market pauses briefly before resuming its primary trend. $MSFT 8H Elliott Wave chart 7.14.2025 The update, 10 days later, shows the stock finding support from the equal legs area as predicted allowing traders to get risk free. The stock is expected to bounce towards 525 – 532 before deciding if the bounce is a connector or the next leg higher. A break into new ATHs will confirm the latter and can see it trade higher towards 570 – 593 area. Until then, traders should get risk free and protect their capital in case of a WXY double correction. Conclusion In conclusion, our Elliott Wave analysis of Microsoft Corp. ($MSFT) suggested that it remains supported against April 07, 2025 lows and bounce from the blue box area. In the meantime, keep an eye out for any corrective pullbacks that may offer entry opportunities. By applying Elliott Wave Theory, traders can better anticipate the structure of upcoming moves and enhance risk management in volatile markets. Source: https://www.fxstreet.com/news/microsoft-corp-msft-blue-box-area-offers-a-buying-opportunity-202509171323
Share
BitcoinEthereumNews2025/09/18 03:50
SHIB Price Analysis for February 8

SHIB Price Analysis for February 8

The post SHIB Price Analysis for February 8 appeared on BitcoinEthereumNews.com. Original U.Today article Can traders expect SHIB to test the $0.0000070 range soon
Share
BitcoinEthereumNews2026/02/09 00:26