

Solana Price Analysis: SOL Risks Further Drop to $75 As Retail Demand Weakens

Highlights:
- Solana price has slipped below $100 to exchange hands at $96, marking a 6% slip today.
- The institutional demand is still low, showing weakening investor confidence.
- The technical picture shows SOL risks further downside towards $75-$50 levels.
Solana (SOL) is trading at less than $100 on Wednesday at press time, having suffered a 6% blow to $96 as the crypto market wobbles. The institutional and retail demand for Solana is still on a downslope trend. Technically, the outlook of SOL may see a downward drop to $75-$50 as more bearish momentum builds.
The institutional inflows have been low in the past three weeks. They have not exceeded $9 million per day since January, with three outflow days. According to Sosovalue data, the US SOL-Exchange-Traded Funds (ETFs) have indications of inflow amounting to $1.24 million on Tuesday.
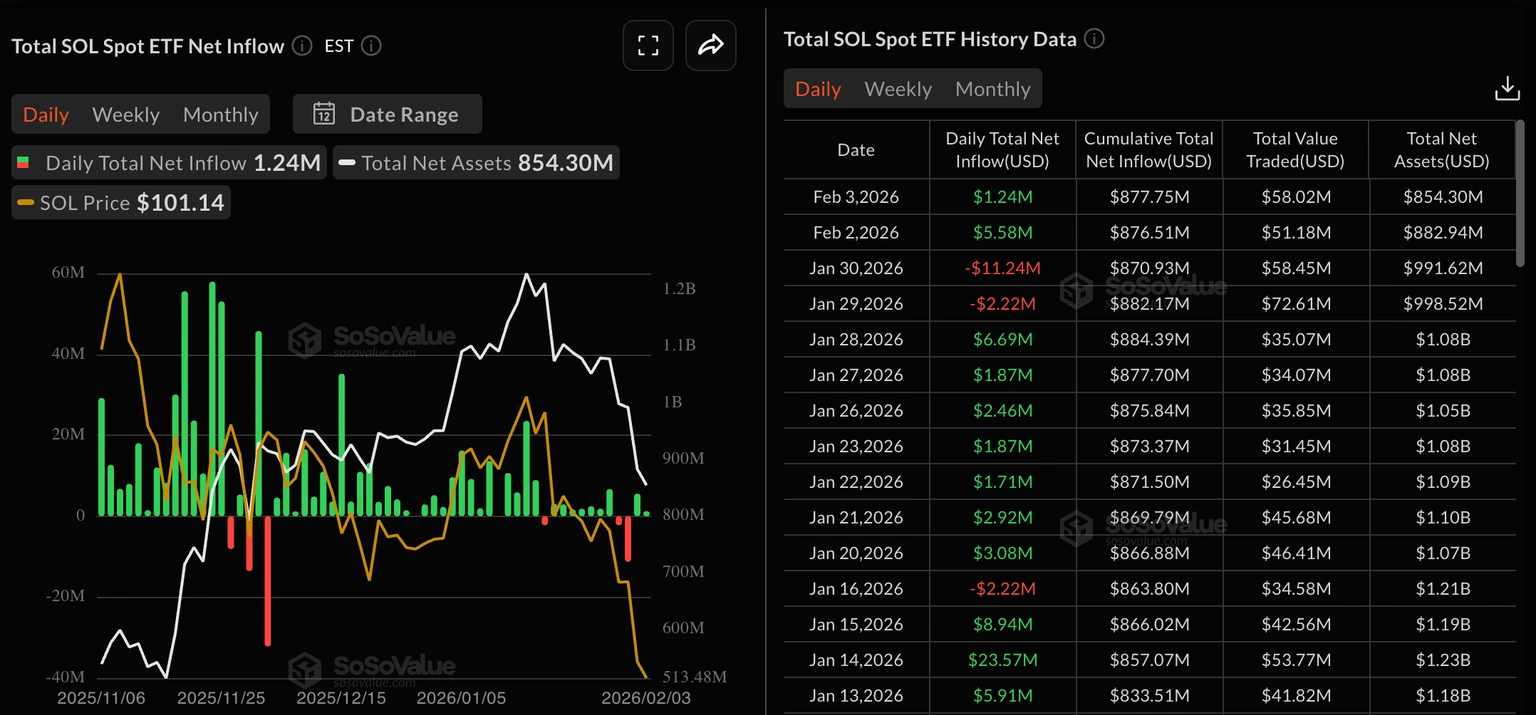 Total SOL Spot ETF Net Inflow: SoSoValue
At the same time, the derivatives market points to a slight positive mood of the market towards Solana in the midst of capital outflows. According to CoinGlass, SOL Open Interest (OI) has increased by 13.91% to $6.59 billion. This means that new money is entering the market and might soon spark a rebound in the SOL market.
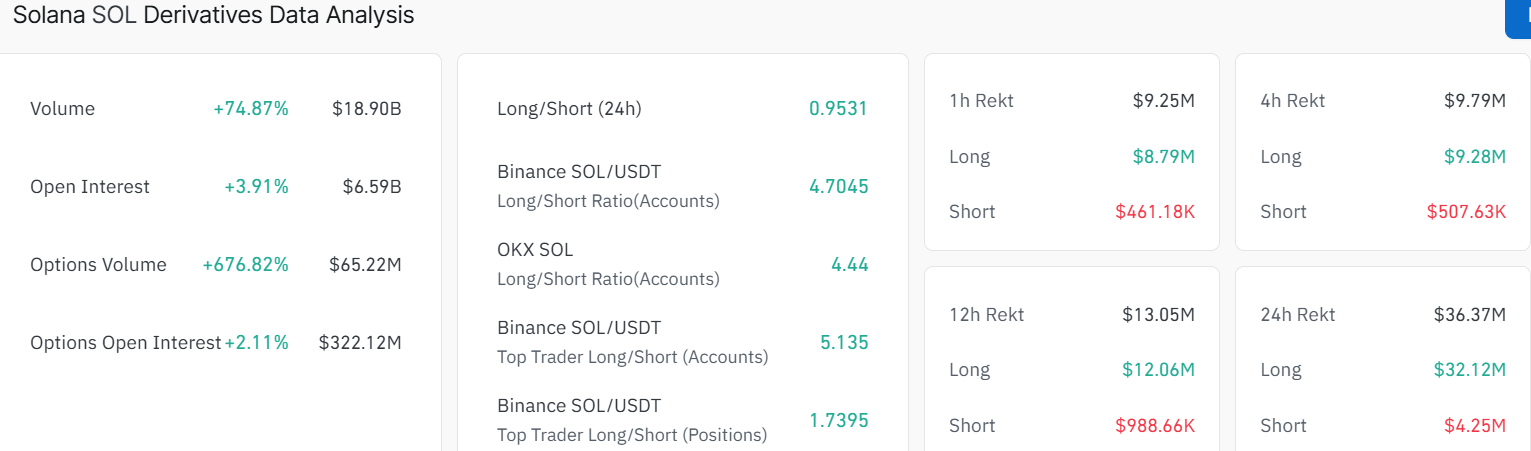 Solana Derivatives Data: CoinGlass
Meanwhile, there is a bearish bias in the closing of positions with the long liquidations of $32.12 million, more than five times the short liquidations of $4.25 million. The long-to-short ratio also sits at 0.9531, as SOL risks further drop towards $75-$50 levels, due to mounting bearish grip.
SOL Price Risks Further Drop to $75-$50 Levels
Solana price has been in a steady downtrend and is currently trading at $96. The altcoin broke down from important support near $127, with sellers quickly pushing the price through the consolidation channel, with the 200-day Simple Moving Average (SMA) and the 50-day SMA, both turning into resistance.
The next major support zone is the $94-$85 level. This area saw strong buy interest earlier in the year and could attract new buyers if the price stabilises. Meanwhile, the above resistance sits around $127-$168, with the 50-day and 200-day SMAs ready to block any rebounds. If SOL can reclaim this area, a push higher to $200 might be possible, but selling pressure remains strong.
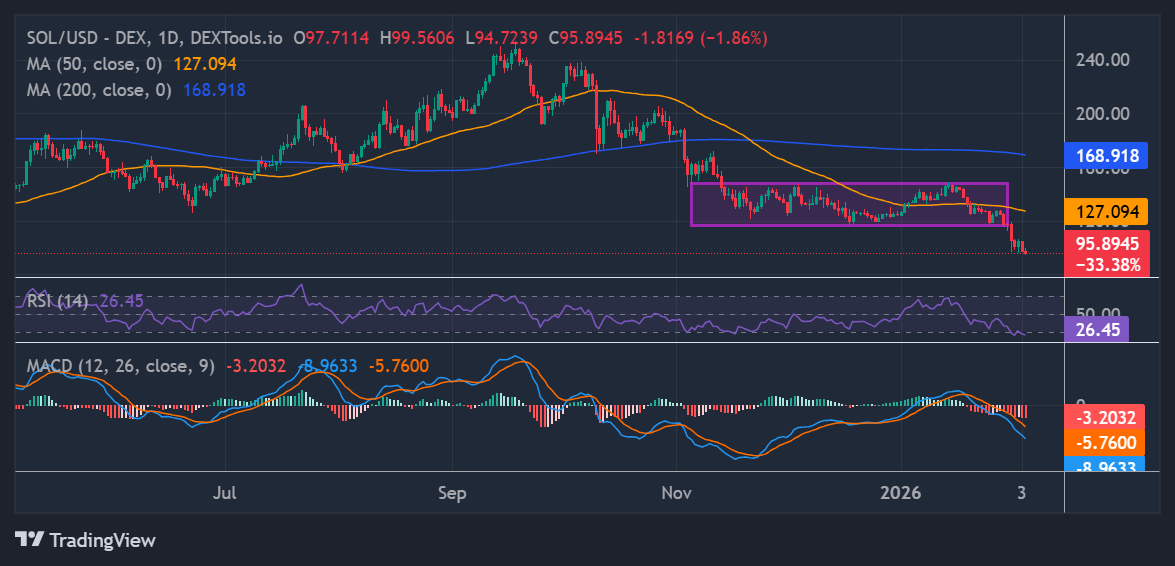 SOL/USD 1-day chart: TradingView
Key indicators confirm a negative outlook in the market. The Relative Strength Index (RSI) has dropped to 26.45, showing that Solana is heavily oversold, but it is not yet signalling any signs of a reversal. The MACD indicator (Moving Average Convergence Divergence) is bearish, with the blue MACD line below the orange signal line and both in negative territory, highlighting the intense selling appetite.
Looking ahead, if the price fails to hold above $127, further losses towards $94-$85 could come swiftly. Moreover, popular crypto analyst Ali Martinez has predicted that the $74-$50 could be the next support zones for the altcoin.
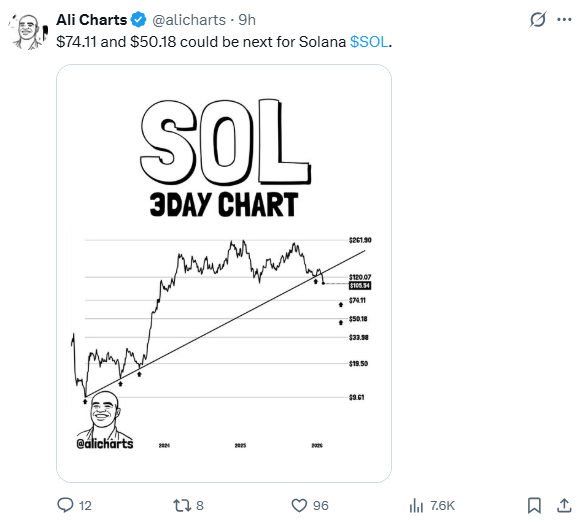 Source: X
For now, the outlook for SOL remains cautious. Short-term dips may provide opportunities for brave buyers, as the trend remains negative.
eToro Platform
Best Crypto Exchange
- Over 90 top cryptos to trade
- Regulated by top-tier entities
- User-friendly trading app
- 30+ million users
eToro is a multi-asset investment platform. The value of your investments may go up or down. Your capital is at risk. Don’t invest unless you’re prepared to lose all the money you invest. This is a high-risk investment, and you should not expect to be protected if something goes wrong.


You May Also Like

Forest Lake honors nationwide sales force at 12th National Convention following record 2025 growth

Syscoin pauses bridge after exploit mints 5 billion unauthorized SYS tokens

One of Ethereum’s Prominent Figures Made a $170 Million Move, Shaking Up the Market! – He Spoke About the ETH Drop!


