

One Bitcoin Chart Correctly Predicts the 5% Bounce — But 3 Metrics Now Question It
The Bitcoin price saw a short-term rebound after slipping to recent lows, gaining nearly 5% from its late-January bottom to test the $76,980 zone. This BTC price move followed a bullish momentum setup on the 4-hour chart, where selling pressure appeared to weaken.
At first glance, the BTC rebound looked technically justified. A familiar short-term pattern had played out before. But a closer look at on-chain and market structure data shows that three major metrics are now questioning whether this bounce can develop into a sustained recovery.
Chart Setup That Pointed to a 5% Bounce
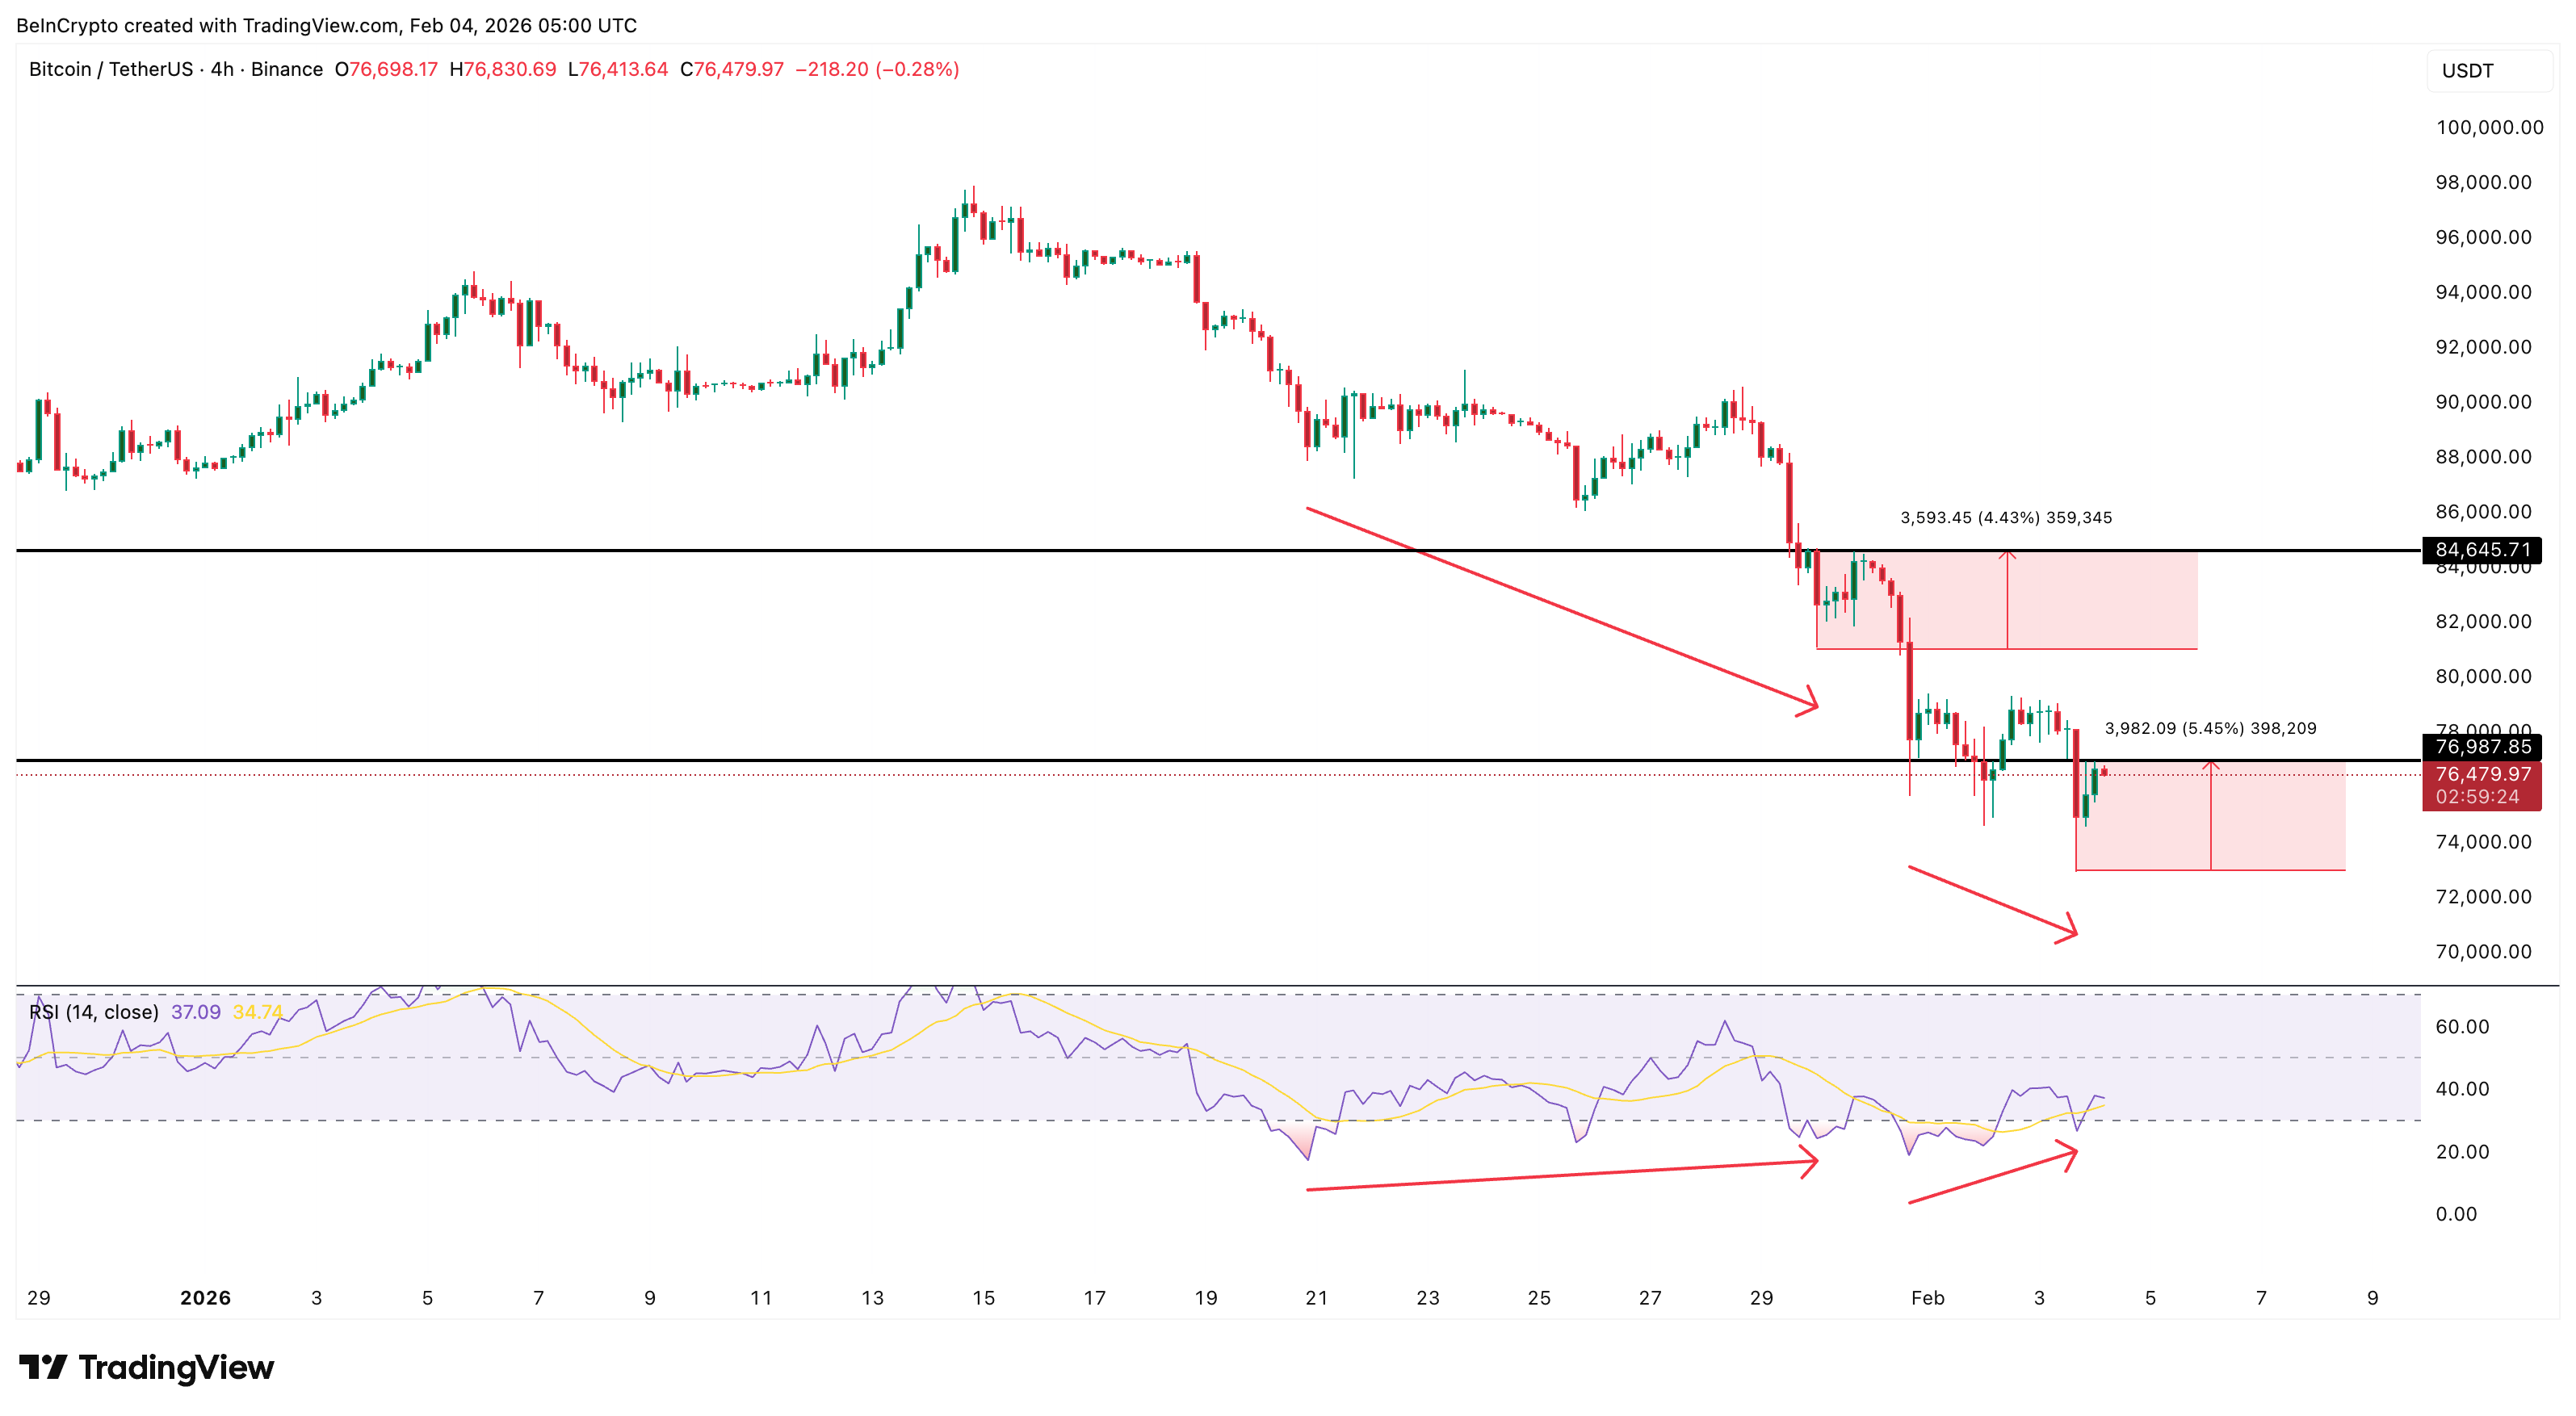
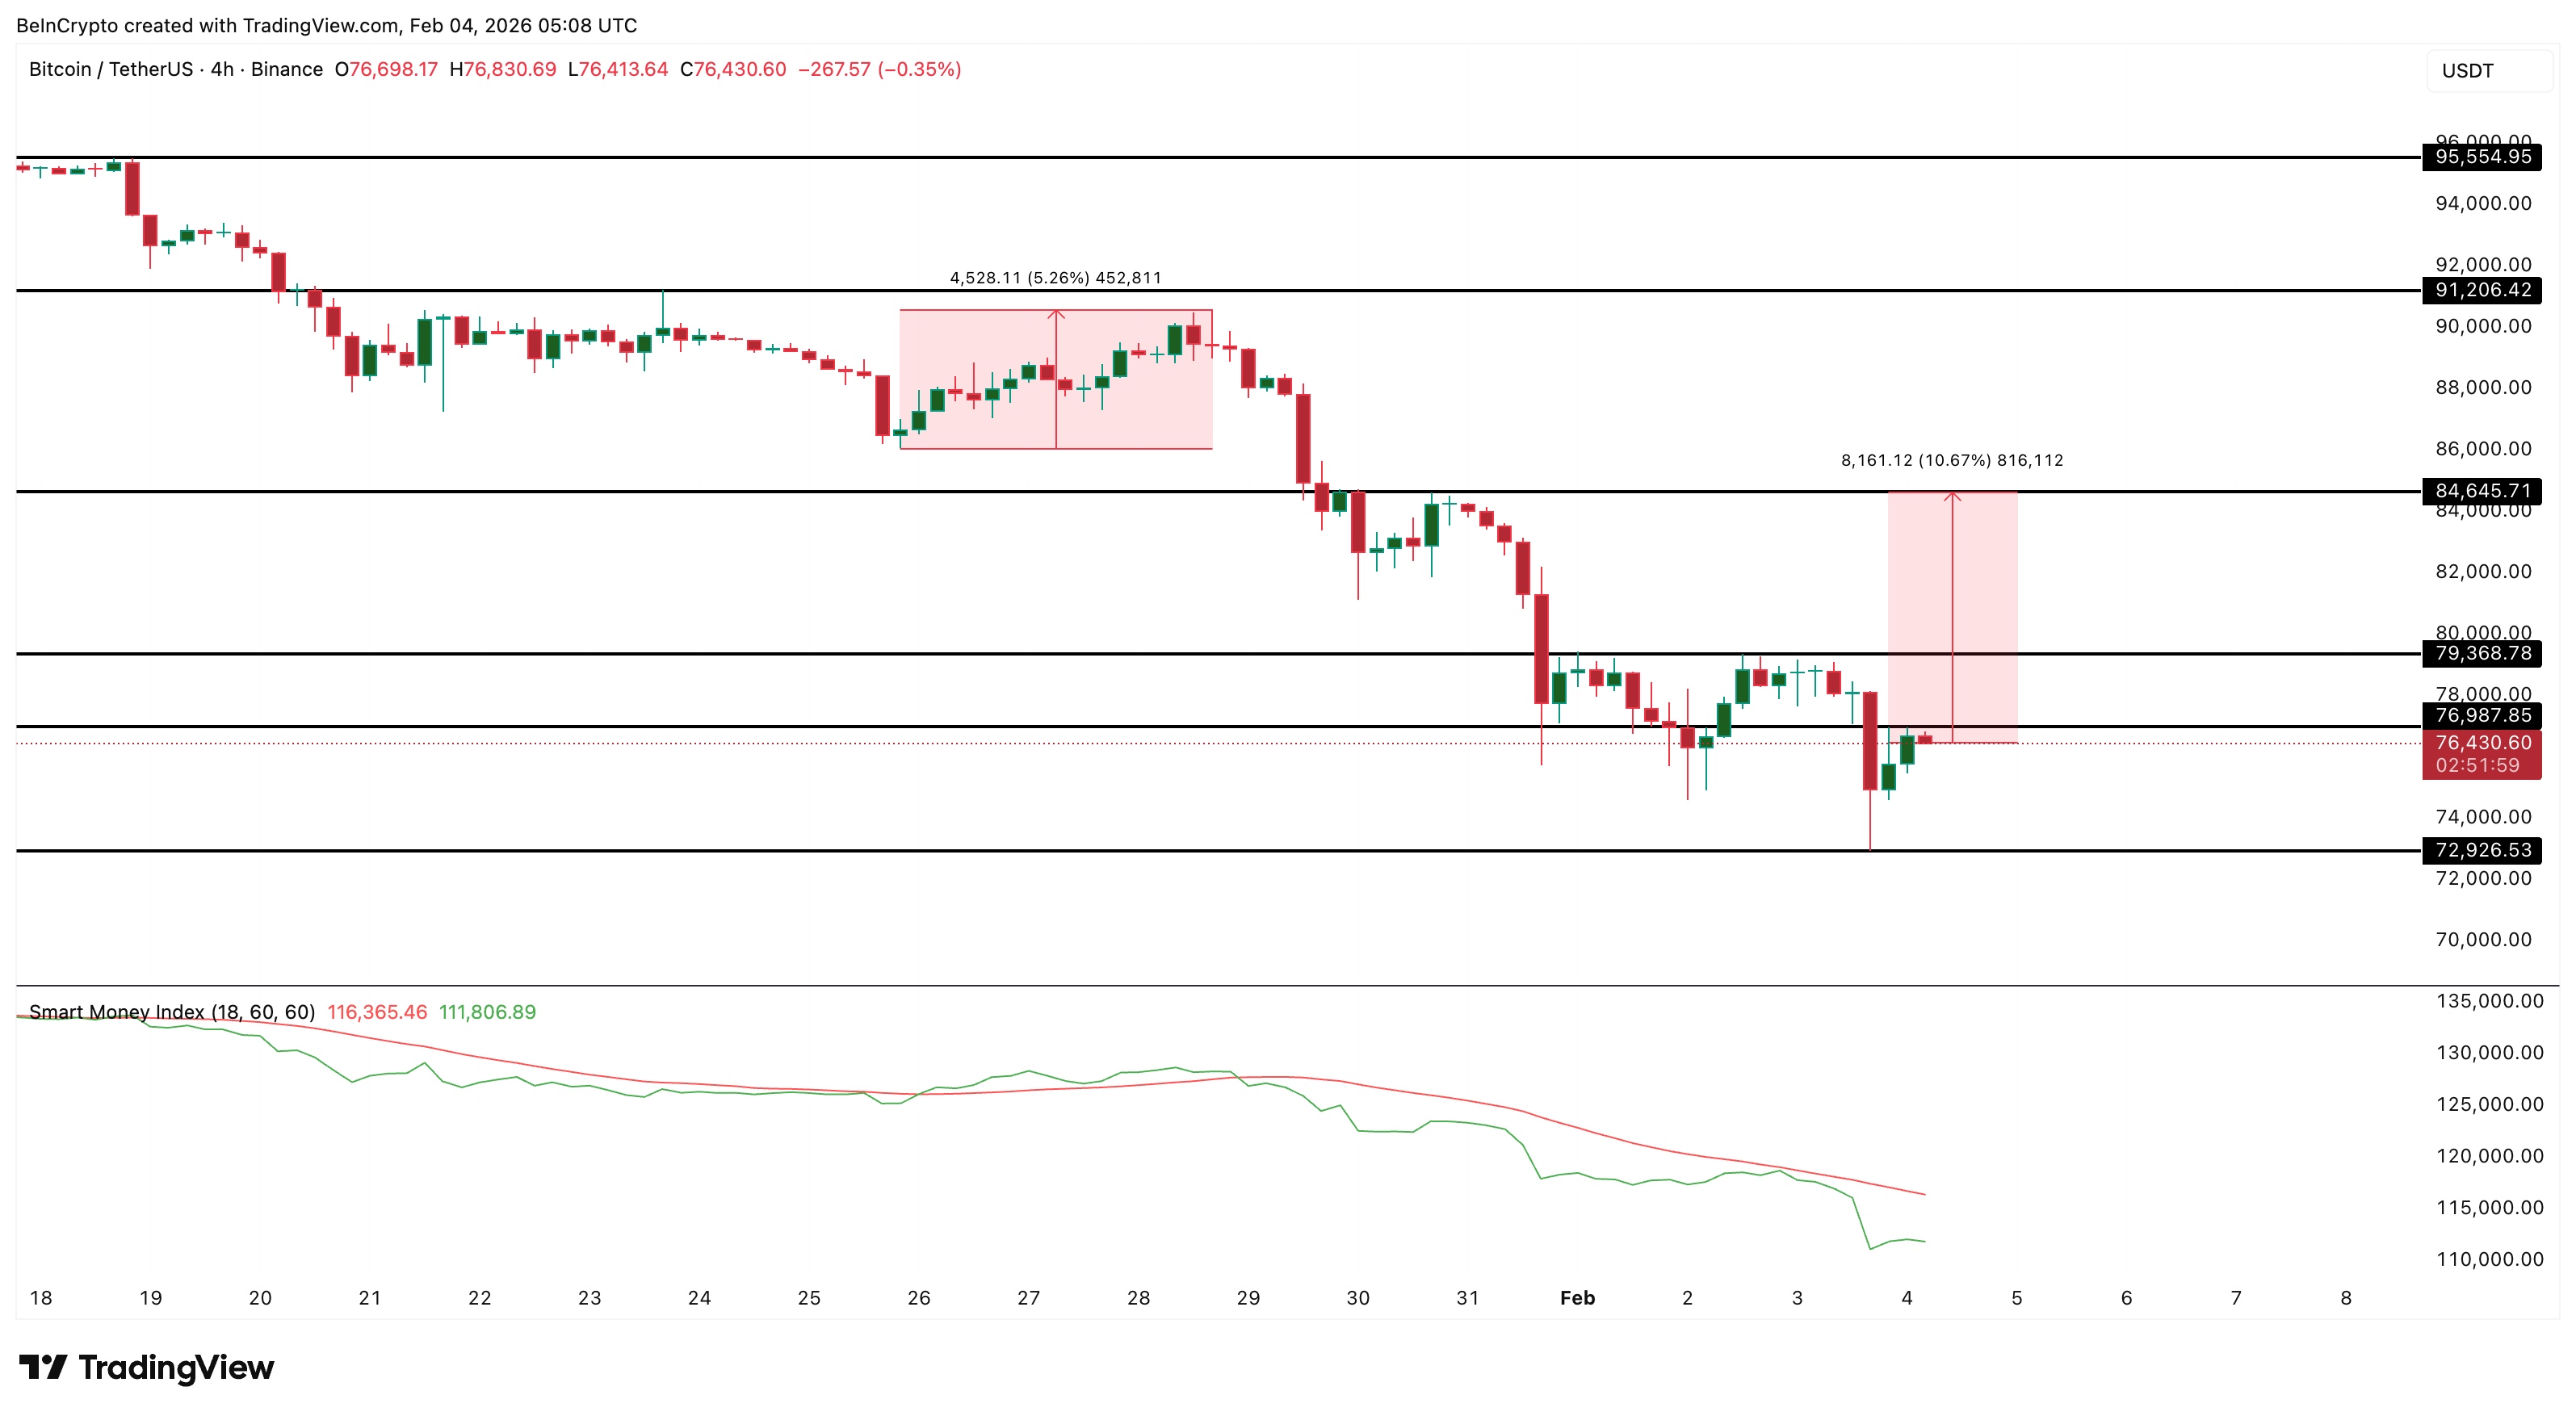
On the 4-hour timeframe, Bitcoin formed a bullish divergence between January 31 and February 3.
During this period, the price of BTC made a lower low, while the Relative Strength Index (RSI), a momentum indicator, formed a higher low. This pattern often appears when selling pressure starts fading and short-term rebounds, albeit on a shorter timeframe, become likely.
A similar divergence appeared earlier between January 20 and January 30. That setup led to a rally toward $84,640 before sellers took control again.
Want more token insights like this? Sign up for Editor Harsh Notariya’s Daily Crypto Newsletter here.
 BTC Rebound Catalyst: TradingView
This time, the pattern produced a rebound of nearly 5%, lifting Bitcoin toward $76,980. The move followed the same technical script as before, reinforcing the idea that the bounce was structurally valid.
The BTC price bounce also had macro backing, as mentioned by Martin Gaspar, Senior Crypto Market Strategist at FalconX. He attributed the move to a rotation from precious metals, right before the divergence flashed:
But technical setups only work when buyers continue supporting them. And this is where the first major challenge appears.
Metric One — URPD Shows Strong Sell Walls at Key BTC Levels
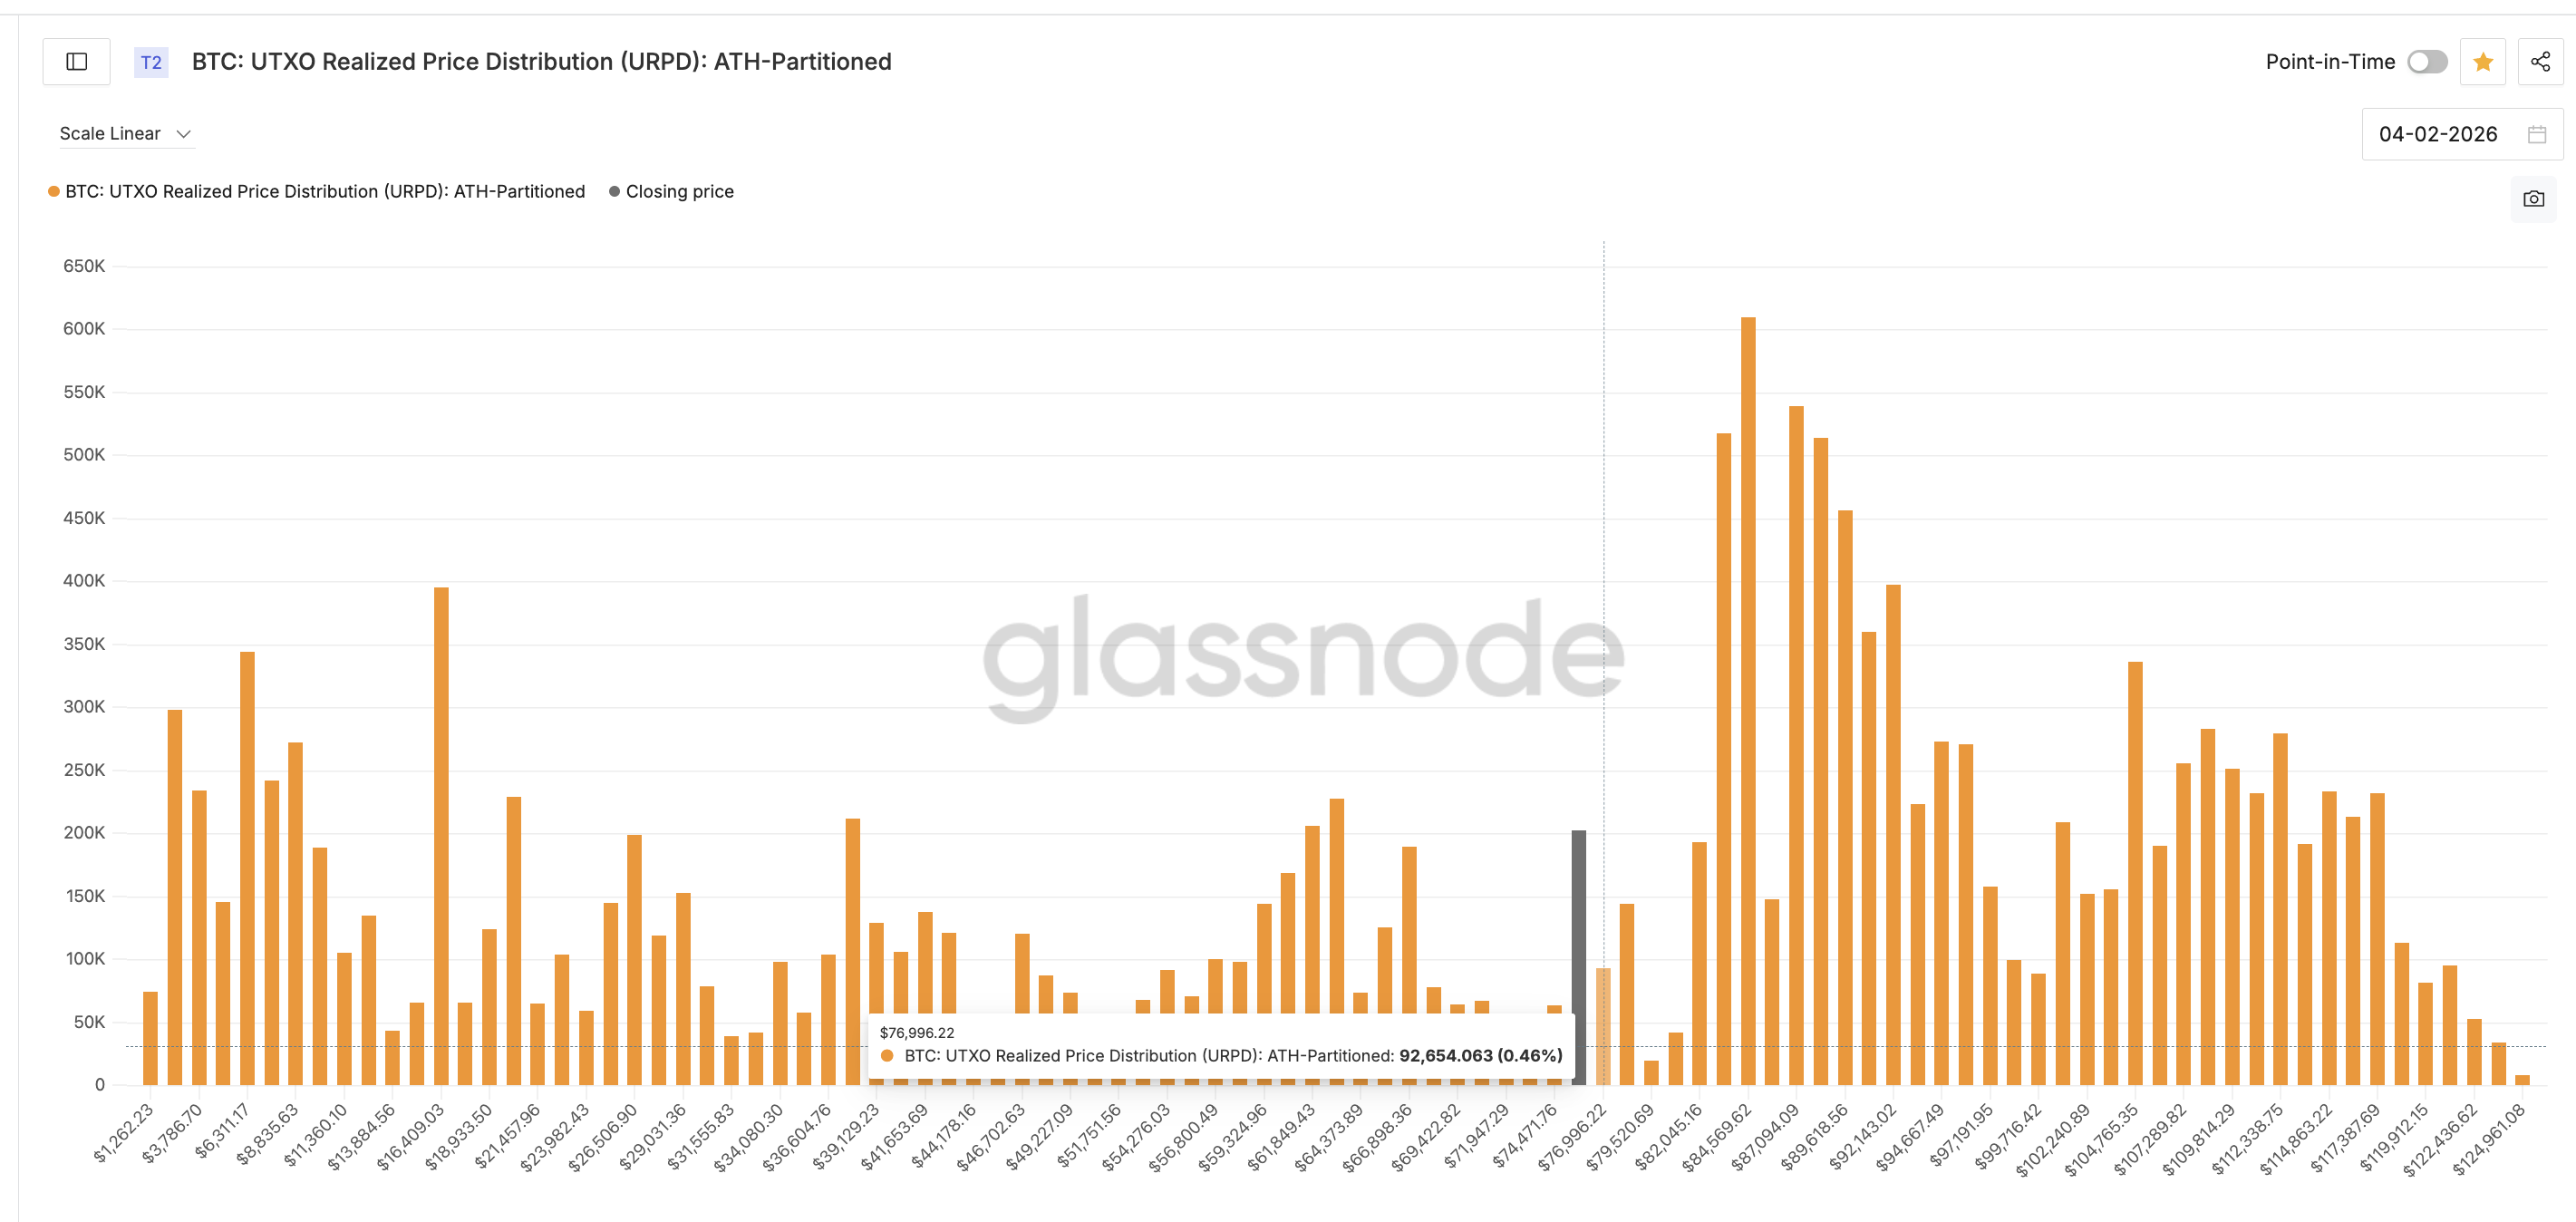
The first metric questioning the rebound is the UTXO Realized Price Distribution (URPD), which maps where large portions of Bitcoin’s supply last moved.
URPD data shows that the area near $76,990 contains around 0.46% of the total supply. This makes it a notable supply cluster, where many holders are sitting near their break-even levels. That explains why the recent 5% bounce stalled at $76,980.
 Key Cluster: Glassnode
When price approaches these zones, selling pressure often increases as investors look to exit without losses.
This pattern has already appeared once before.
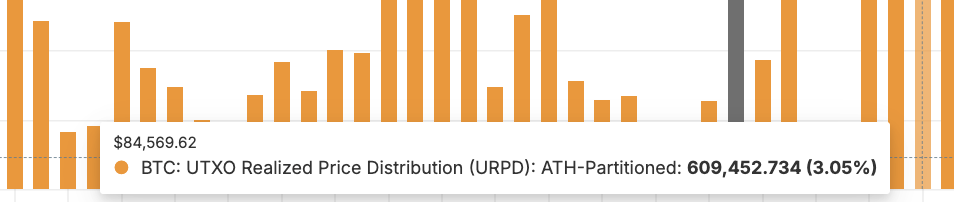
The earlier BTC rebound in late January (mentioned earlier) stalled near $84,640, close to the URPD zone, showing a massive 3.05% supply cluster. That wall proved too strong to break.
 The Biggest BTC Price Blocker: Glassnode
Now, the latest rebound has once again stopped near another supply-heavy zone. This suggests that rebounds are being capped by holders, possibly selling into resistance rather than building new positions. Without enough fresh demand, these sell walls remain difficult to clear.
Rising Exchange Reserves and Weak SOPR Show Low Conviction
The second and third metrics come from exchange flows and profit behavior, and together they paint a concerning picture.
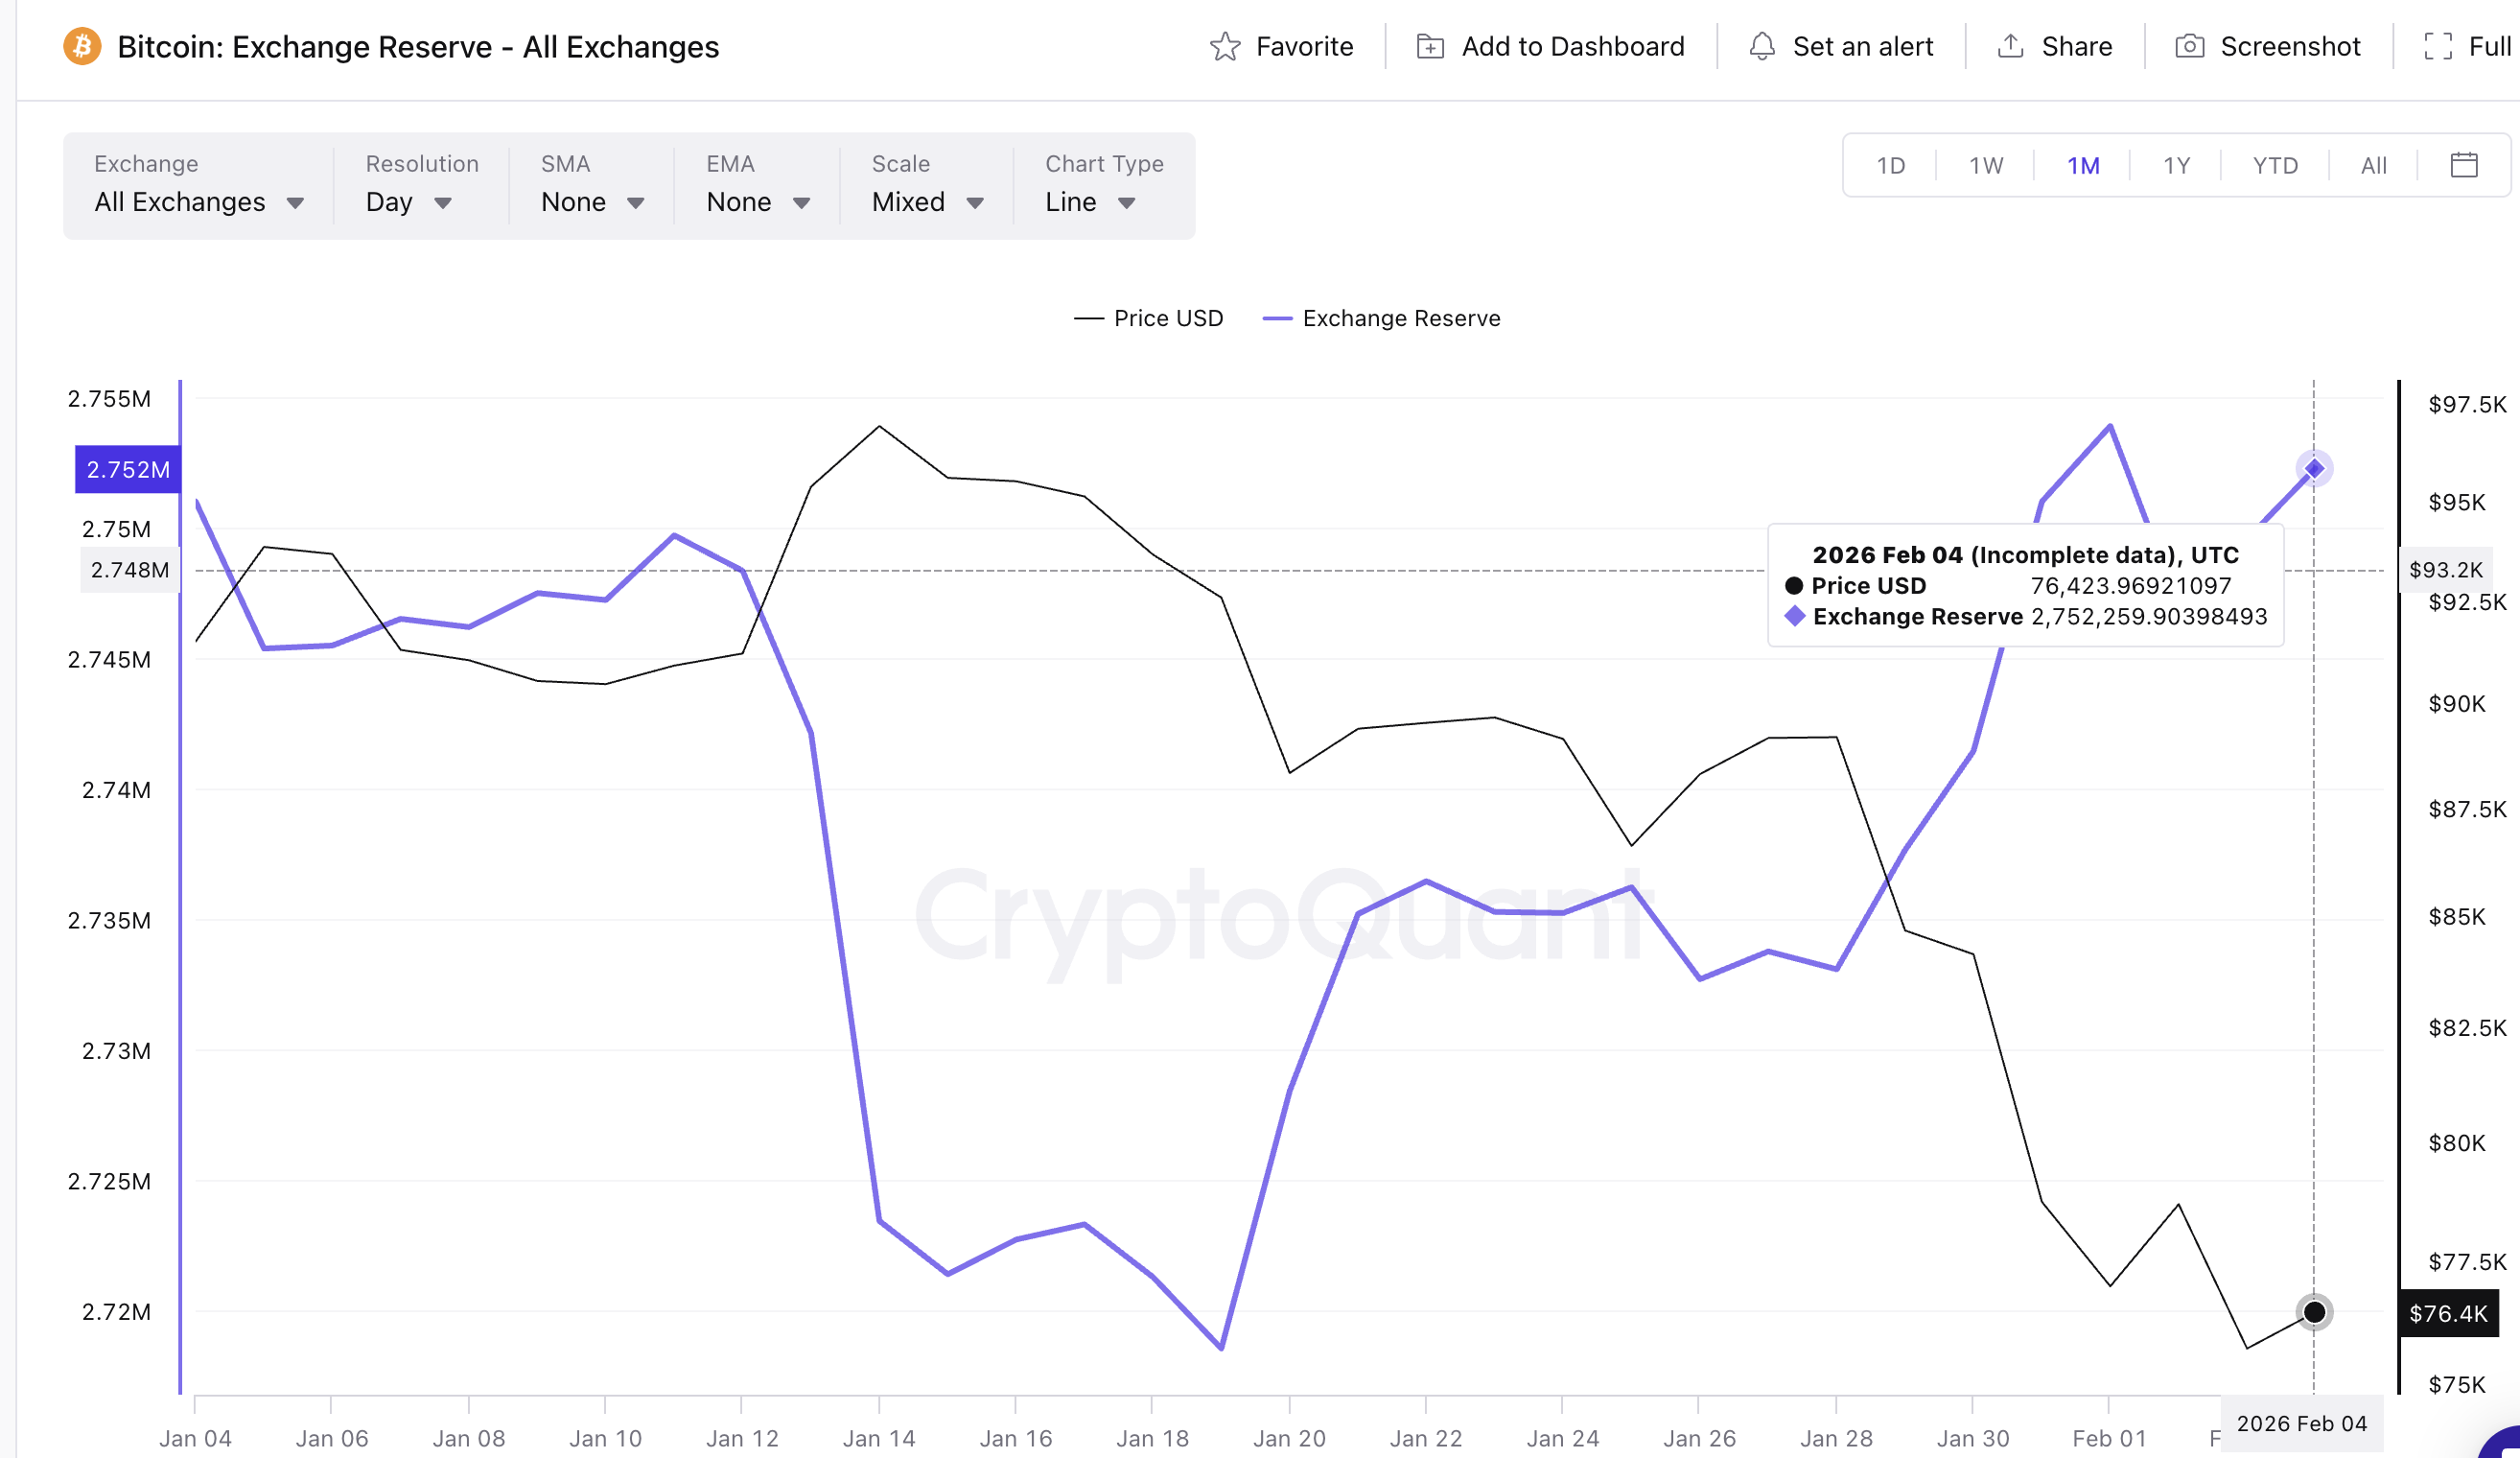
Bitcoin exchange reserves hit a recent low of 2.718 million BTC on January 19. Since then, reserves have climbed to about 2.752 million BTC.
That is an increase of roughly 34,000 BTC, or around 1.2% in less than three weeks.
 BTC Reserves Surging: CryptoQuant
Instead of coins leaving exchanges for long-term holding, more Bitcoin is now being moved back onto trading platforms. This usually reflects growing readiness to sell rather than accumulate.
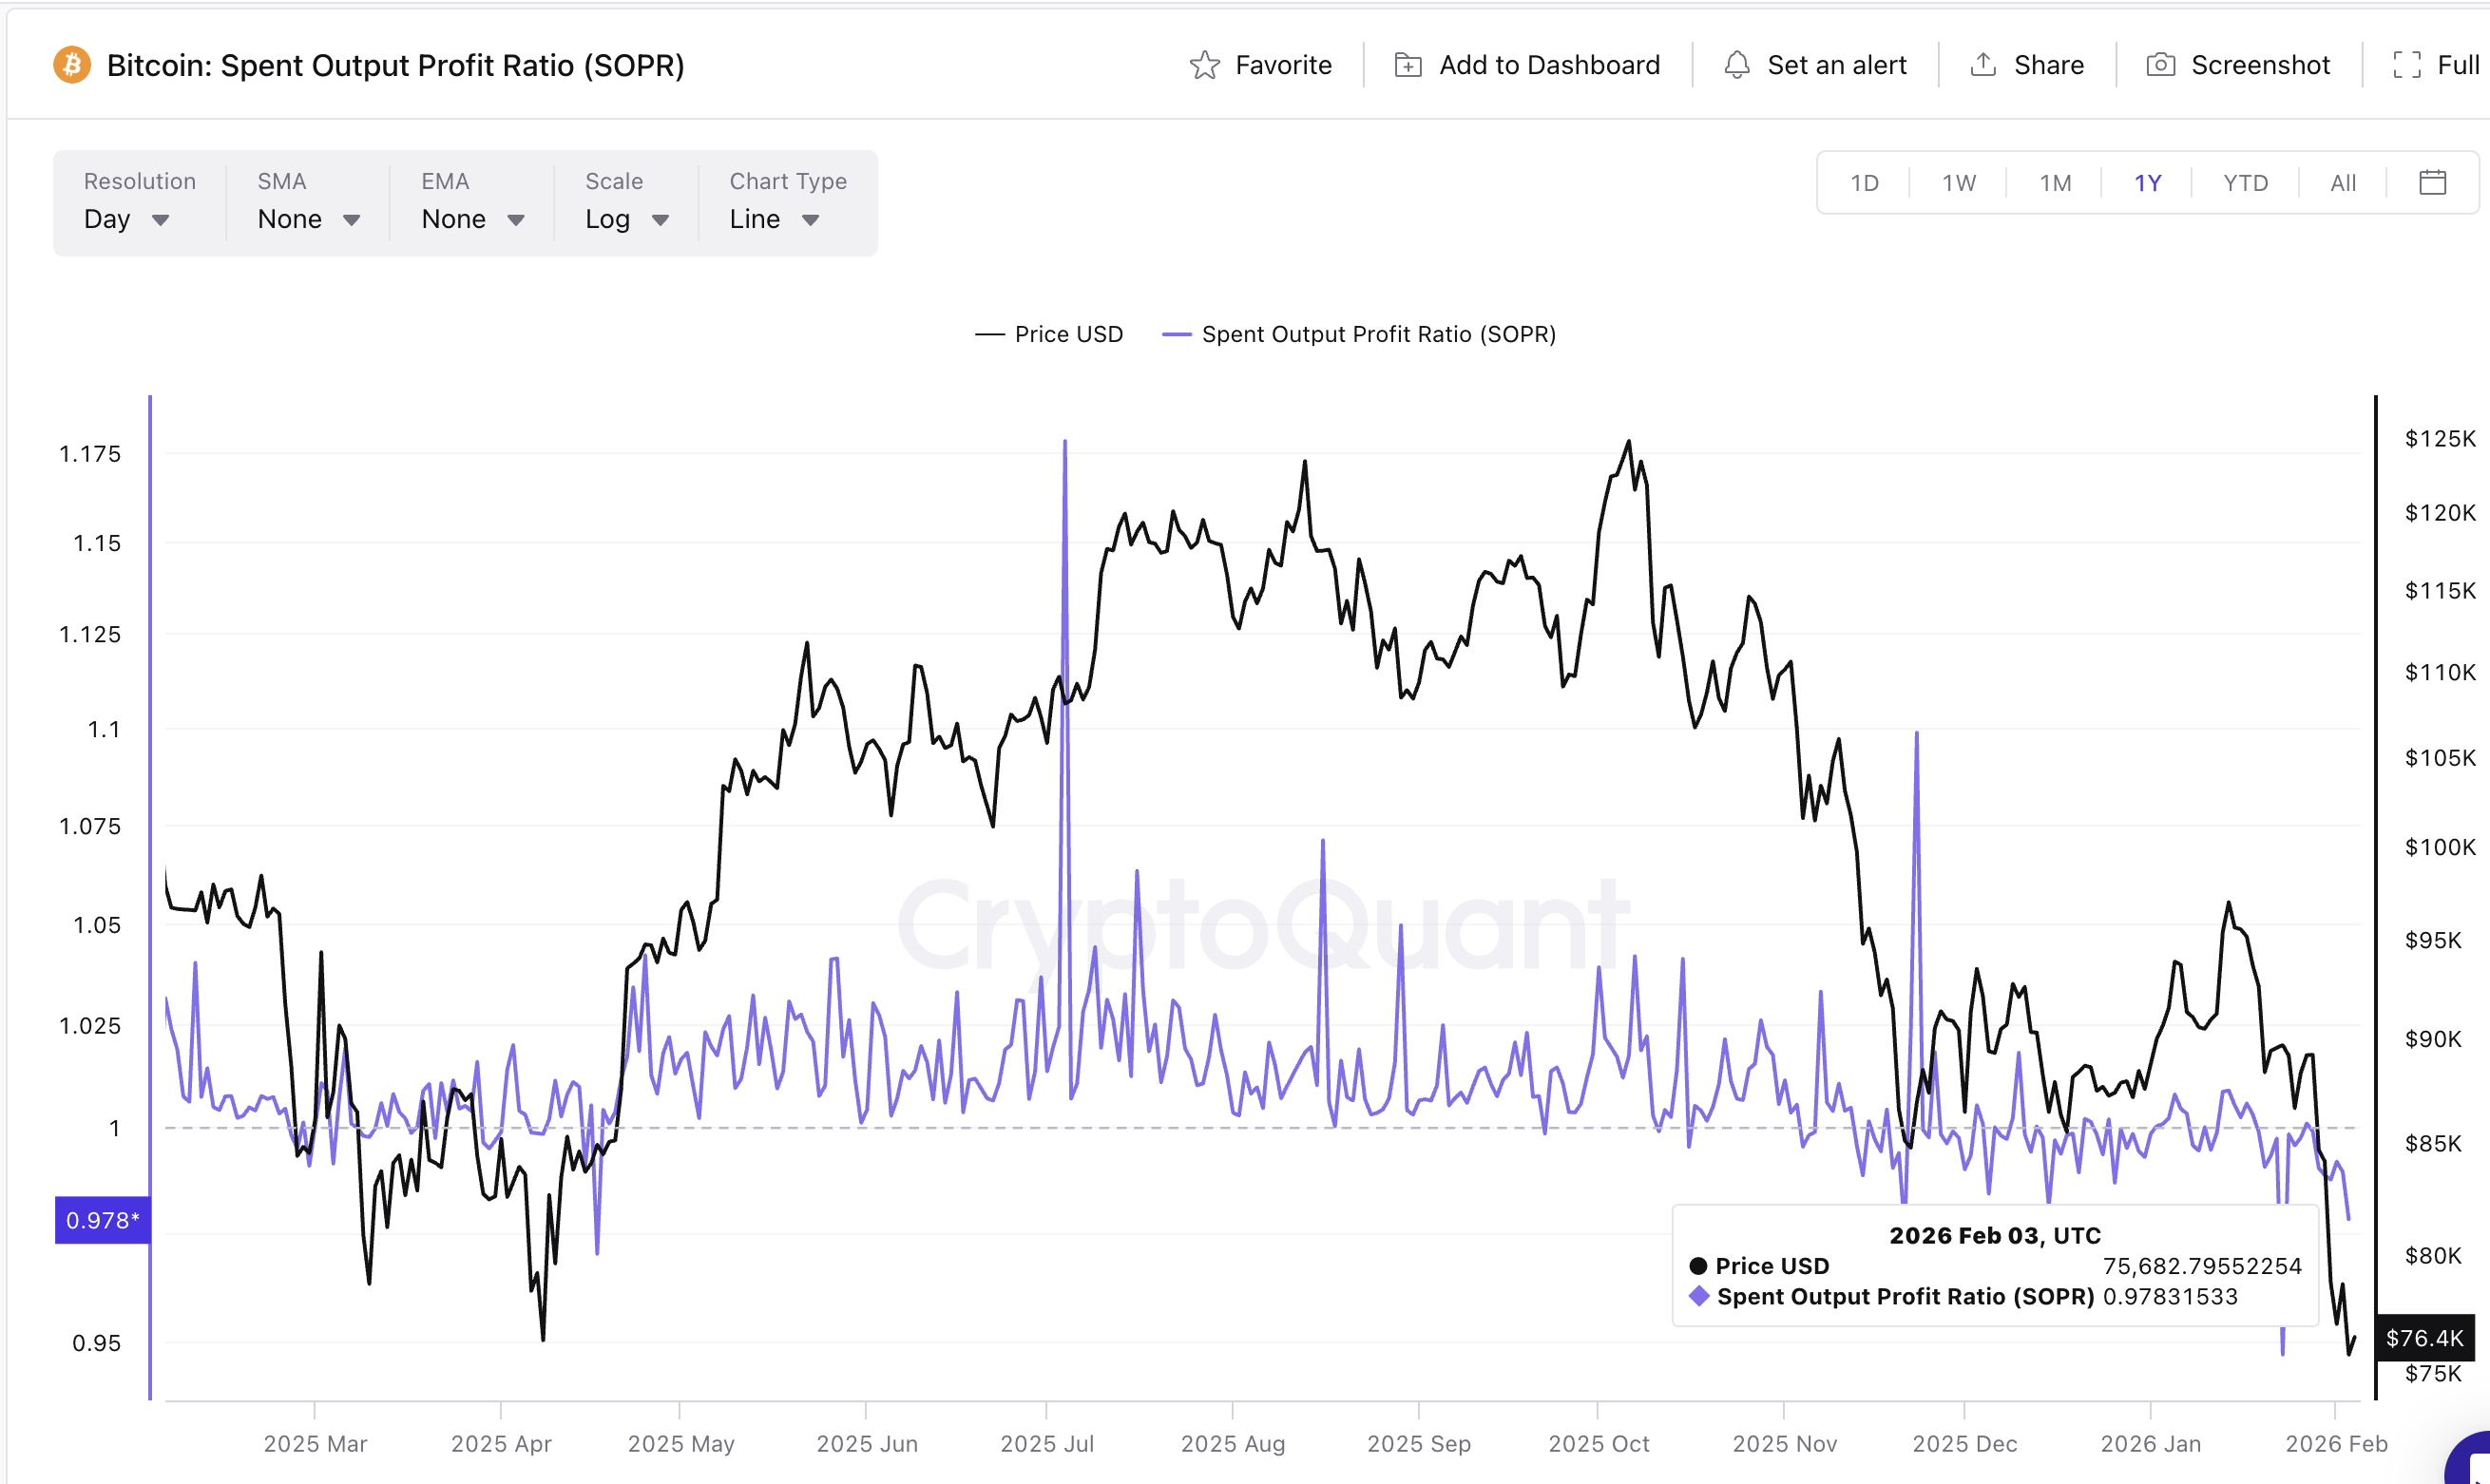
At the same time, the Spent Output Profit Ratio (SOPR) is hovering near yearly lows. SOPR measures whether coins are being sold at a profit or a loss. A value below 1 means investors are realizing losses.
In late January, SOPR dropped close to 0.94. It currently sits near 0.97, still below the neutral level. This means many holders are selling even when they are underwater.
 SOPR Hints At Sharp Exits: CryptoQuant
When rising exchange reserves combine with low SOPR, it signals defensive behavior. Investors are using rebounds to exit positions instead of building long-term exposure.
This weakens the foundation of any recovery unless a major catalyst appears. Martin Gaspar from FalconX, however, hints at one sentiment-driven catalyst tied to regulatory clarity that might try to change the BTC price outlook:
But the price levels still hold the key!
Bitcoin Price Levels and Smart Money Show the Rebound Is Losing Support
The Bitcoin price action confirms what the three metrics are suggesting. For Bitcoin to regain momentum, several levels must be cleared:
- $76,980: Immediate resistance from the current supply cluster
- $79,360: Next short-term barrier
- $84,640: Major long-term resistance tied to the largest BTC URPD zone
A sustained recovery requires clean 4-hour closes above these levels, especially above $84,640. So far, the BTC price has failed to establish strength above the first barrier.
The Smart Money Index adds another layer of caution. This indicator tracks institutional-style positioning. On the 4-hour chart, it has been trending below its signal line since late January. This shows that larger players are not increasing exposure alongside the rebound.
 Bitcoin Price Analysis: TradingView
The last time the index briefly crossed above its signal line in late January, Bitcoin rallied about 5%. That confirmation is currently missing. Without renewed smart money participation, every short-term BTC rebound might fade.
Also, if the increased panic-driven selling, as highlighted by a falling SOPR, pushes the BTC price down, $72,920 becomes a key zone. New downside targets can come into play if a 4-hour candle closes below it.
You May Also Like

Over 60% of crypto press releases linked to high-risk or scam projects: Report

Outlook remains cautious – TD Securities
