The post Cardano Price Enters Key Demand Zone—Short-Term Pullback Could Set Up a Rebound appeared first on Coinpedia Fintech News Cardano has entered a criticalThe post Cardano Price Enters Key Demand Zone—Short-Term Pullback Could Set Up a Rebound appeared first on Coinpedia Fintech News Cardano has entered a critical

Cardano Price Enters Key Demand Zone—Short-Term Pullback Could Set Up a Rebound

2026/01/31 22:17
3 min read
For feedback or concerns regarding this content, please contact us at crypto.news@mexc.com
Cardano (ADA) Reclaims a Key Resistance—Is a Major Rally About to Begin

The post Cardano Price Enters Key Demand Zone—Short-Term Pullback Could Set Up a Rebound appeared first on Coinpedia Fintech News

Cardano has entered a critical technical phase as selling pressure accelerates into early 2026. After failing to sustain its late-2025 recovery, ADA has resumed a broader corrective move and is now trading near long-term demand levels. Since the start of 2026, price action has remained decisively bearish, with lower highs and expanding downside momentum. The weekly chart now places the ADA price at a make-or-break zone, where the next reaction is likely to define whether the market sees a deeper correction or a technical rebound.

Cardano Price Analysis: ADA Enters a Crucial Demand Phase

On the weekly timeframe, ADA is trading near $0.30, down sharply from its early-2026 highs near the $0.40–$0.45 region. Since January 2026, the token has printed consecutive bearish candles, reflecting sustained distribution rather than a short-term pullback. Price is now testing a historically significant support band between $0.28 and $0.30, a zone that has previously acted as both support and resistance across multiple cycles.

ada price

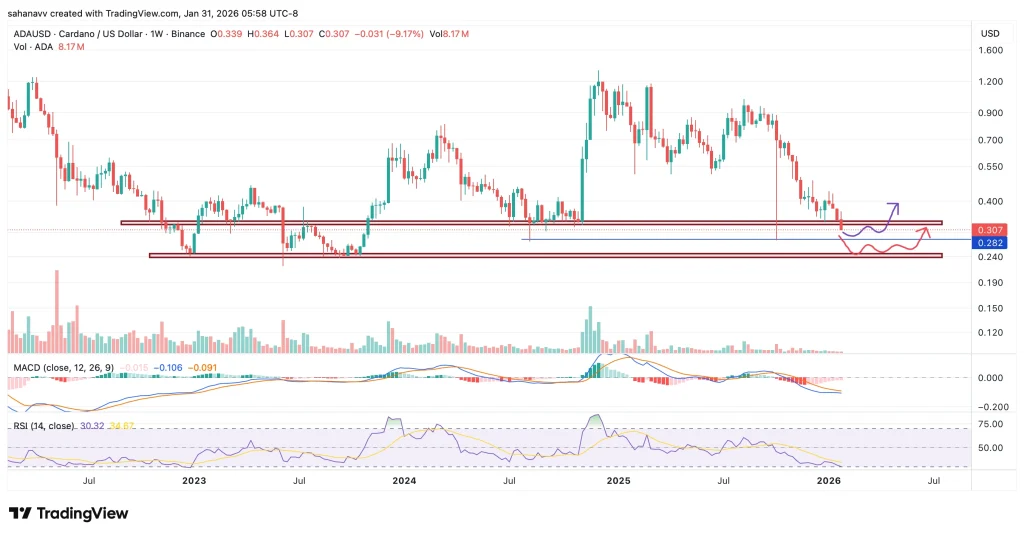
From a structural perspective, ADA remains in a broader descending range, with price compressing into a well-defined demand zone. The chart highlights two potential paths:

Scenario 1: Support is defended
If the $0.28–$0.30 support band holds, ADA may form a base similar to prior accumulation phases. In this case, the ongoing decline in RSI (currently near 30) could push into oversold territory, historically a zone where buyers have stepped in. A stabilisation here could trigger a technical rebound toward $0.36–$0.40, aligning with prior resistance.

Scenario 2: Support fails
If ADA loses $0.28 on a weekly closing basis, the lack of nearby demand opens the door to a deeper retracement toward $0.24–$0.22, marking the next major demand cluster.

Momentum indicators remain weak. The MACD is firmly bearish, with expanding negative histogram bars, confirming trend continuation rather than exhaustion. Meanwhile, the RSI continues to slope downward, suggesting downside pressure may persist before any meaningful relief rally develops.

What’s Next for ADA Price?

Technically, ADA is approaching a zone where downside risk and rebound probability begin to overlap. While momentum remains bearish and further weakness cannot be ruled out, the $0.28–$0.30 region represents a historically reactive area. A failure here would likely extend losses toward the low-$0.20s, while a successful defence could allow a corrective rebound rather than a trend reversal. 

Collectively, the Cardano (ADA) price may continue to remain under bearish conditions unless the token reclaims $0.4.

Disclaimer: The articles reposted on this site are sourced from public platforms and are provided for informational purposes only. They do not necessarily reflect the views of MEXC. All rights remain with the original authors. If you believe any content infringes on third-party rights, please contact crypto.news@mexc.com for removal. MEXC makes no guarantees regarding the accuracy, completeness, or timeliness of the content and is not responsible for any actions taken based on the information provided. The content does not constitute financial, legal, or other professional advice, nor should it be considered a recommendation or endorsement by MEXC.
Tags:

You May Also Like

Today’s Biggest Crypto Movers: Dogecoin Leads the Pack

Today’s Biggest Crypto Movers: Dogecoin Leads the Pack

Today's Biggest Crypto Movers: Dogecoin Leads the Pack 🚀 Crypto Markets Heat Up Today Major cryptocurrencies are showing strong gains. Let's dive into today's top
Share
Blockchainmagazine2026/04/03 13:00
RWA Boom Accelerates As Tokenized Assets Hit New Highs In Early 2026

RWA Boom Accelerates As Tokenized Assets Hit New Highs In Early 2026

RWA distributed value rose from about $21B to $27.5B in Q1 2026, a gain of roughly 30%. Tokenized US Treasuries reached about $10B, creating an on-chain yield base
Share
LiveBitcoinNews2026/04/03 13:00
Cryptos Signal Divergence Ahead of Fed Rate Decision

Cryptos Signal Divergence Ahead of Fed Rate Decision

The post Cryptos Signal Divergence Ahead of Fed Rate Decision appeared on BitcoinEthereumNews.com. Crypto assets send conflicting signals ahead of the Federal Reserve’s September rate decision. On-chain data reveals a clear decrease in Bitcoin and Ethereum flowing into centralized exchanges, but a sharp increase in altcoin inflows. The findings come from a Tuesday report by CryptoQuant, an on-chain data platform. The firm’s data shows a stark divergence in coin volume, which has been observed in movements onto centralized exchanges over the past few weeks. Bitcoin and Ethereum Inflows Drop to Multi-Month Lows Sponsored Sponsored Bitcoin has seen a dramatic drop in exchange inflows, with the 7-day moving average plummeting to 25,000 BTC, its lowest level in over a year. The average deposit per transaction has fallen to 0.57 BTC as of September. This suggests that smaller retail investors, rather than large-scale whales, are responsible for the recent cash-outs. Ethereum is showing a similar trend, with its daily exchange inflows decreasing to a two-month low. CryptoQuant reported that the 7-day moving average for ETH deposits on exchanges is around 783,000 ETH, the lowest in two months. Other Altcoins See Renewed Selling Pressure In contrast, other altcoin deposit activity on exchanges has surged. The number of altcoin deposit transactions on centralized exchanges was quite steady in May and June of this year, maintaining a 7-day moving average of about 20,000 to 30,000. Recently, however, that figure has jumped to 55,000 transactions. Altcoins: Exchange Inflow Transaction Count. Source: CryptoQuant CryptoQuant projects that altcoins, given their increased inflow activity, could face relatively higher selling pressure compared to BTC and ETH. Meanwhile, the balance of stablecoins on exchanges—a key indicator of potential buying pressure—has increased significantly. The report notes that the exchange USDT balance, around $273 million in April, grew to $379 million by August 31, marking a new yearly high. CryptoQuant interprets this surge as a reflection of…
Share
BitcoinEthereumNews2025/09/18 01:01

Trade GOLD, Share 1,000,000 USDT

Trade GOLD, Share 1,000,000 USDTTrade GOLD, Share 1,000,000 USDT

0 fees, up to 1,000x leverage, deep liquidity