The bearish zone built in the crypto market is strong enough to pose severe risks across the assets. Their price movements are fluctuating heavily, losing the recentThe bearish zone built in the crypto market is strong enough to pose severe risks across the assets. Their price movements are fluctuating heavily, losing the recent

Bitcoin (BTC) Volume Erupts 184%: Will It Face a Key $85K Bearish Test?

3 min read
  • Bitcoin is trading around the $87.7K mark.
  • BTC’s trading volume has exploded by 184%.

The bearish zone built in the crypto market is strong enough to pose severe risks across the assets. Their price movements are fluctuating heavily, losing the recent gains and momentum. Bitcoin (BTC), the largest asset, is trading on the downside and failing to escape the red. The token’s Fear and Greed Index is holding at 20, reporting extreme fear. 

The asset has posted a 0.95% drop in the last 24 hours, and it opened the day trading at a high of $88,839.22. With the bearish pressure within the BTC market, the price slipped to a bottom of $86,003.71. Bitcoin is trading at $87,739.60, and the trading volume has exploded by 184% to $44.55 billion. Notably, the BTC market has seen a liquidation of $191.49 million. 

With the bearish Bitcoin trading chart, the price could fall to its support range at around $87,470. Further correction on the downside might initiate the emergence of the death cross, and the bears send the price below $87.1K. Upon a momentum reversal, the Bitcoin price might rise and find the resistance at the $88K level. If the upside pressure strengthens, it could trigger the formation of the golden cross, with the bulls taking the price above $88,329. 

Momentum Shifts Against Bitcoin as Indicators Flash Downside Risk

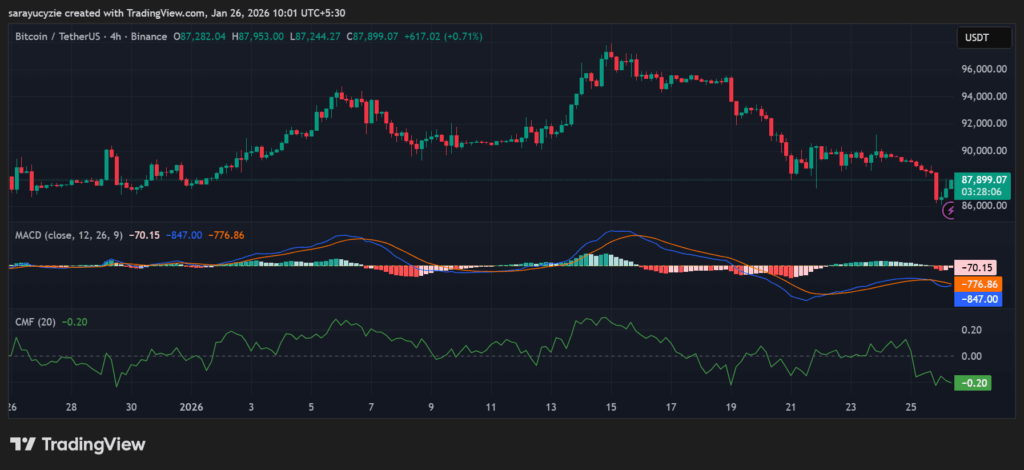
The technical analysis of the BTC/USDT pair displays the formation of red candles. The Moving Average Convergence Divergence and the signal lines are below the zero line, indicating a bearish shift. The asset is trading below its longer-term average, and a potential trend shift is possible if the MACD starts moving back above zero.

BTC chart (Source: TradingView)

In addition, the indicator used to analyse the money flow, the Chaikin Money Flow (CMF), is at 0.20, which suggests strong selling pressure in the BTC market. The money is flowing out of the asset, and the distribution is dominating accumulation. Significantly, the values are this far below zero, aligning with the ongoing bearish momentum.

Bitcoin’s daily Relative Strength Index (RSI) is found at 39.97, implying a weak sentiment leaning bearish. It is below the neutral level but not yet oversold. This exhibits a continued downside or consolidation, unless the buying strength picks up and pushes back above 50. 

Furthermore, the Bull Bear Power (BBP) reading of -996.67 signals extremely strong bearish dominance. The sellers are firmly in control, and the downside pressure of BTC is intense. Also, it can sometimes precede a short-term relief bounce if the selling becomes exhausted.

Top Updated Crypto News

Andreessen Horowitz-Backed Entropy Announces Shutdown

Disclaimer: The articles reposted on this site are sourced from public platforms and are provided for informational purposes only. They do not necessarily reflect the views of MEXC. All rights remain with the original authors. If you believe any content infringes on third-party rights, please contact service@support.mexc.com for removal. MEXC makes no guarantees regarding the accuracy, completeness, or timeliness of the content and is not responsible for any actions taken based on the information provided. The content does not constitute financial, legal, or other professional advice, nor should it be considered a recommendation or endorsement by MEXC.

You May Also Like

Egrag Crypto: XRP Could be Around $6 or $7 by Mid-November Based on this Analysis

Egrag Crypto: XRP Could be Around $6 or $7 by Mid-November Based on this Analysis

Egrag Crypto forecasts XRP reaching $6 to $7 by November. Fractal pattern analysis suggests a significant XRP price surge soon. XRP poised for potential growth based on historical price patterns. The cryptocurrency community is abuzz after renowned analyst Egrag Crypto shared an analysis suggesting that XRP could reach $6 to $7 by mid-November. This prediction is based on the study of a fractal pattern observed in XRP’s past price movements, which the analyst believes is likely to repeat itself in the coming months. According to Egrag Crypto, the analysis hinges on fractal patterns, which are used in technical analysis to identify recurring market behavior. Using the past price charts of XRP, the expert has found a certain fractal that looks similar to the existing market structure. The trend indicates that XRP will soon experience a great increase in price, and the asset will probably reach the $6 or $7 range in mid-November. The chart shared by Egrag Crypto points to a rising trend line with several Fibonacci levels pointing to key support and resistance zones. This technical structure, along with the fractal pattern, is the foundation of the price forecast. As XRP continues to follow the predicted trajectory, the analyst sees a strong possibility of it reaching new highs, especially if the fractal behaves as expected. Also Read: Why XRP Price Remains Stagnant Despite Fed Rate Cut #XRP – A Potential Similar Set-Up! I've been analyzing the yellow fractal from a previous setup and trying to fit it into various formations. Based on the fractal formation analysis, it suggests that by mid-November, #XRP could be around $6 to $7! Fractals can indeed be… pic.twitter.com/HmIlK77Lrr — EGRAG CRYPTO (@egragcrypto) September 18, 2025 Fractal Analysis: The Key to XRP’s Potential Surge Fractals are a popular tool for market analysis, as they can reveal trends and potential price movements by identifying patterns in historical data. Egrag Crypto’s focus on a yellow fractal pattern in XRP’s price charts is central to the current forecast. Having contrasted the market scenario at the current period and how it was at an earlier time, the analyst has indicated that XRP might revert to the same price scenario that occurred at a later cycle in the past. Egrag Crypto’s forecast of $6 to $7 is based not just on the fractal pattern but also on broader market trends and technical indicators. The Fibonacci retracements and extensions will also give more insight into the price levels that are likely to be experienced in the coming few weeks. With mid-November in sight, XRP investors and traders will be keeping a close eye on the market to see if Egrag Crypto’s analysis is true. If the price targets are reached, XRP could experience one of its most significant rallies in recent history. Also Read: Top Investor Issues Advance Warning to XRP Holders – Beware of this Risk The post Egrag Crypto: XRP Could be Around $6 or $7 by Mid-November Based on this Analysis appeared first on 36Crypto.
Share
Coinstats2025/09/18 18:36
‘High Risk’ Projects Dominate Crypto Press Releases, Report Finds

‘High Risk’ Projects Dominate Crypto Press Releases, Report Finds

The post ‘High Risk’ Projects Dominate Crypto Press Releases, Report Finds appeared on BitcoinEthereumNews.com. More than six in 10 crypto press releases published
Share
BitcoinEthereumNews2026/02/04 13:09
Why Vitalik Says L2s Aren’t Ethereum Shards Now?

Why Vitalik Says L2s Aren’t Ethereum Shards Now?

The post Why Vitalik Says L2s Aren’t Ethereum Shards Now? appeared on BitcoinEthereumNews.com. Vitalik says Ethereum’s scaling and higher gas limits mean L2s no
Share
BitcoinEthereumNews2026/02/04 13:18