

Cardano (ADA) Price: What Happens Next After 15% Drop?
TLDR
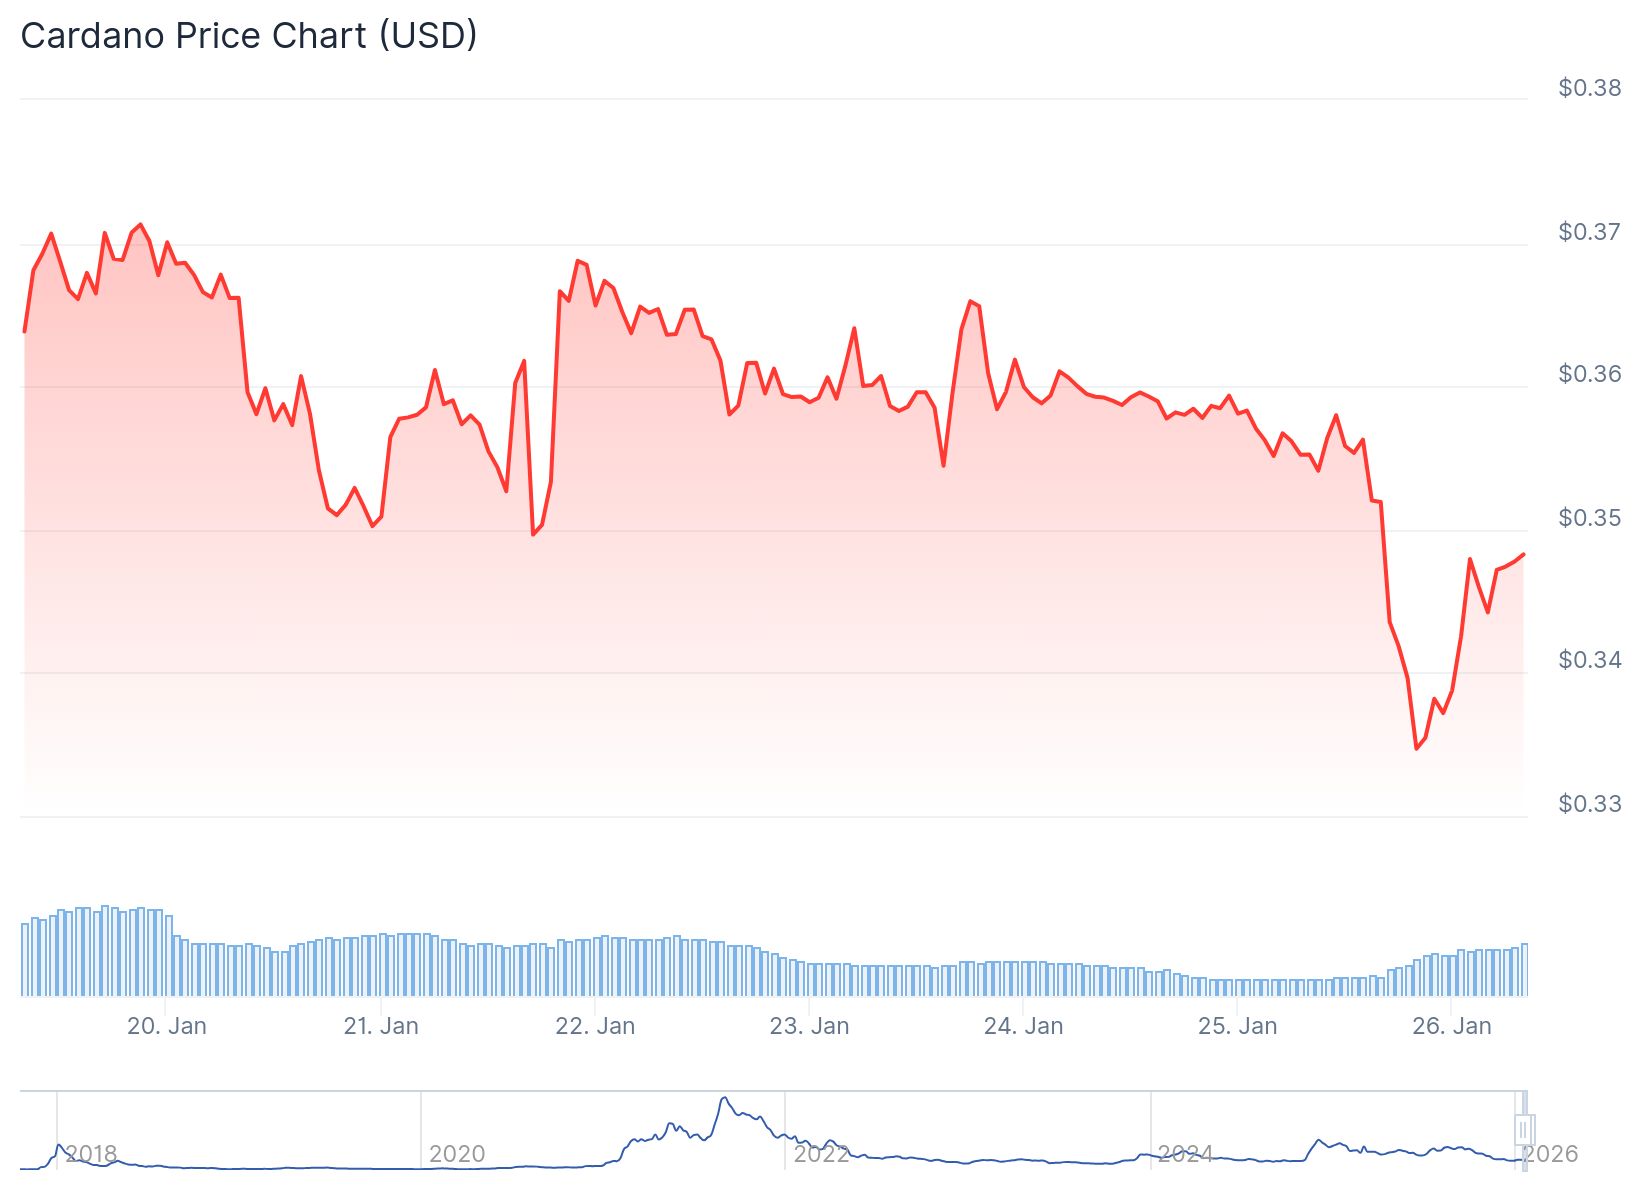
- Cardano (ADA) dropped nearly 15% over the past week and is now trading around $0.34
- The token is testing a key support zone near $0.33 that has historically held during weak market conditions
- Market analyst Butterfly notes that buyers appear to be accumulating near the lower edge of the price channel
- Weekly indicators including MACD and Money Flow Index continue to favor sellers with bearish momentum
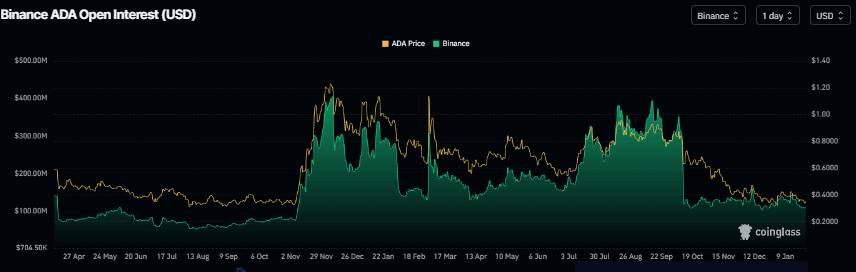
- Open Interest at Binance dropped to its lowest level since December 25, showing reduced trader participation
Cardano has fallen into a critical technical zone following a sharp decline over the past seven days. The cryptocurrency was trading around $0.34 on January 25, marking a drop of approximately 15% from the previous week, according to CoinMarketCap data.
 Cardano (ADA) Price
The token is now testing a demand zone near $0.33 that traders have watched closely during previous periods of market weakness. This area represents a key level where buyers have historically stepped in to support the price.
On the two-day chart, ADA remains trapped within a clear bearish channel. The pattern shows a series of lower highs and lower lows, indicating sustained selling pressure over recent months.
Previous attempts to break above this channel have been rejected at the upper boundary. Each rally has stalled near the top of the channel before prices retreated back toward the lower edge.
Market analyst Butterfly posted on January 25 that ADA found support near the lower edge of this descending channel. The analyst observed that buyers appear to be accumulating tokens as selling pressure weakens at these levels.
Current Technical Structure
TradingView data shows ADA tracking along the inner path of the downtrend channel. The middle line of this channel acts as a balance point that prices tend to return to before making their next move.
If buying pressure increases, ADA might attempt to climb back toward the middle range of the channel. However, resistance remains strong at higher levels.
The top of the channel sits between $0.60 and $0.70. This zone has acted as an area where sellers typically enter the market. Any bounce from current levels would be considered a correction unless ADA can break and hold above the channel structure.
A failure to maintain the current support zone would strengthen the bearish case. Breaking below the $0.32 to $0.33 level could speed up the decline since the channel pattern would remain intact.
Weekly Indicators Point to Continued Pressure
The weekly chart presents a cautious picture for ADA holders. The token trades below all major exponential moving averages, showing that sellers maintain control. The 20-week EMA sits around $0.50, while the 50, 100, and 200-week EMAs range between $0.57 and $0.61.
The Money Flow Index currently reads 16.8, pointing to weak money flows entering the market. This suggests limited new buying power developing at present.
The MACD indicator remains in negative territory with bearish momentum building. This technical signal has not yet shown signs of reversing.
The Relative Strength Index on the daily chart reads 39, below its neutral level of 50. This indicates bearish momentum continues to gain traction in the short term.
Declining Open Interest
Futures Open Interest for Cardano at Binance exchange dropped to $108.55 million on Sunday. This marks the lowest level recorded since December 25, based on Coinglass data.
 Source: Coinglass
The drop in Open Interest reflects reduced trader participation in ADA futures markets. Lower Open Interest typically suggests waning investor interest in opening new positions.
Cardano faced rejection from the 50-day Exponential Moving Average at $0.39 on January 14. The price then declined nearly 10% over the following four days, closing below the daily support at $0.38.
If the correction continues, ADA could test the December 31 low of $0.32. A close below this level might lead to further losses toward the October 10 low of $0.27.
The post Cardano (ADA) Price: What Happens Next After 15% Drop? appeared first on CoinCentral.


You May Also Like

Central banks to raise rates amid inflation from Iran’s oil supply cuts: FT

Algorand quietly beat Bitcoin and Ethereum due to quantum risks


