

Bitcoin Price Defends Support As Traders Question Next Upside Push
Bitcoin price started a fresh decline below $89,500. BTC is consolidating losses and might attempt a recovery wave if it clears $92,000.
- Bitcoin started another drop below $90,000 and $89,000.
- The price is trading below $90,500 and the 100 hourly Simple moving average.
- There are two bearish trend lines forming with resistance at $90,300 and $93,000 on the hourly chart of the BTC/USD pair (data feed from Kraken).
- The pair might continue to move down if it stays below the $92,000 zone.
Bitcoin Price Dips To New Weekly Lows
Bitcoin price failed to stay above the $91,000 support and started a fresh decline. BTC declined sharply below the $90,000 and $89,500 support levels.
The bears even pushed the price below $88,000. A low was formed at $87,200, and the price is now consolidating losses. There was a minor recovery wave above $89,200 and the 23.6% Fib retracement level of the recent decline from the $95,475 swing high to the $87,200 low.
Bitcoin is now trading below $90,500 and the 100 hourly Simple moving average. If the price remains stable above $88,000, it could attempt a fresh increase. Immediate resistance is near the $90,500 level. Besides, there are two bearish trend lines forming with resistance at $90,300 and $93,000 on the hourly chart of the BTC/USD pair.
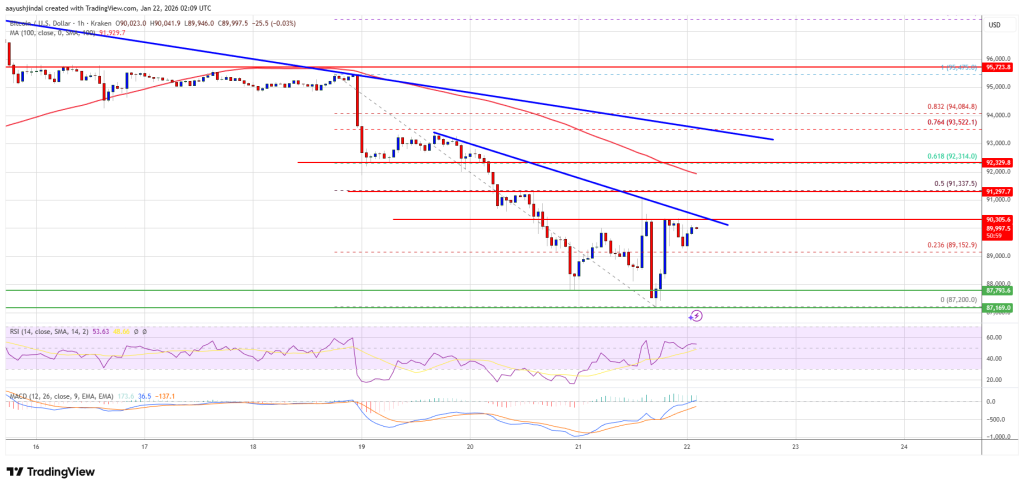
The first key resistance is near the $91,000 level. The next resistance could be $91,350 or the 50% Fib retracement level of the recent decline from the $95,475 swing high to the $87,200 low. A close above the $91,350 resistance might send the price further higher. In the stated case, the price could rise and test the $93,000 resistance. Any more gains might send the price toward the $94,000 level. The next barrier for the bulls could be $95,000 and $95,500.
Another Decline In BTC?
If Bitcoin fails to rise above the $91,350 resistance zone, it could start another decline. Immediate support is near the $89,150 level. The first major support is near the $88,000 level.
The next support is now near the $87,200 zone. Any more losses might send the price toward the $86,500 support in the near term. The main support sits at $85,500, below which BTC might accelerate lower in the near term.
Technical indicators:
Hourly MACD – The MACD is now losing pace in the bearish zone.
Hourly RSI (Relative Strength Index) – The RSI for BTC/USD is now above the 50 level.
Major Support Levels – $89,150, followed by $88,000.
Major Resistance Levels – $91,350 and $92,000.


You May Also Like

Bitcoin Miners Warn No Bottom Yet, CryptoQuant Says—What On-Chain Metrics Reveal

Anchor plops Trumper in hotseat over president’s 'grift'

Veterans urge GOP to back War Powers Resolution and honor 13 Americans killed in Iran


