A loss of over 3% has traders on edge and crypto tokens in cautious territory. A slight bullish shift might bring in a fresh breath into the market. SignificantlyA loss of over 3% has traders on edge and crypto tokens in cautious territory. A slight bullish shift might bring in a fresh breath into the market. Significantly

PEPE Under Pressure: Can the Bulls Fight Off the Bears or Will It Fall Again?

2026/01/21 21:44
3 min read
For feedback or concerns regarding this content, please contact us at crypto.news@mexc.com
  • PEPE is currently hovering around $0.0000049.
  • The daily trading volume has surged by over 17%.

A loss of over 3% has traders on edge and crypto tokens in cautious territory. A slight bullish shift might bring in a fresh breath into the market. Significantly, the meme coin market has followed suit, dropping 4.8%, settling at around $43.6 billion. At the same time, the frog-themed token PEPE has fallen 2.97% in the past 24 hours.

The meme coin kickstarted the trading day with the price at a high of $0.000005176. Eventually, the bears took charge of the PEPE market, and a bottom trading range was found at $0.000004868. The asset is currently hovering at $0.000004931 with its daily trading volume surging by over 17.09%, reaching the $463.97 million mark.

With the active bearish momentum of PEPE, the price could decline back toward the crucial support at the $0.000004921 level. More losses might strengthen the bears, and they likely bring in a key retest below the $0.000004911 range, with the emergence of the death cross. 

On the flip side, upon a trend reversal of the meme coin, the price might initiate a move on the upside. This would push the PEPE price to climb and find the nearby resistance at $0.000004941. If the bulls stay for long, the golden cross could form, driving the price above $0.000004951.

PEPE Technicals Suggest Bears Are in Charge

When both the Moving Average Convergence Divergence (MACD) and signal lines cross below the zero line, it hints at a clear shift into bearish territory. The downside momentum of PEPE is strengthening, and the traders see this as an increased risk of further price weakness.

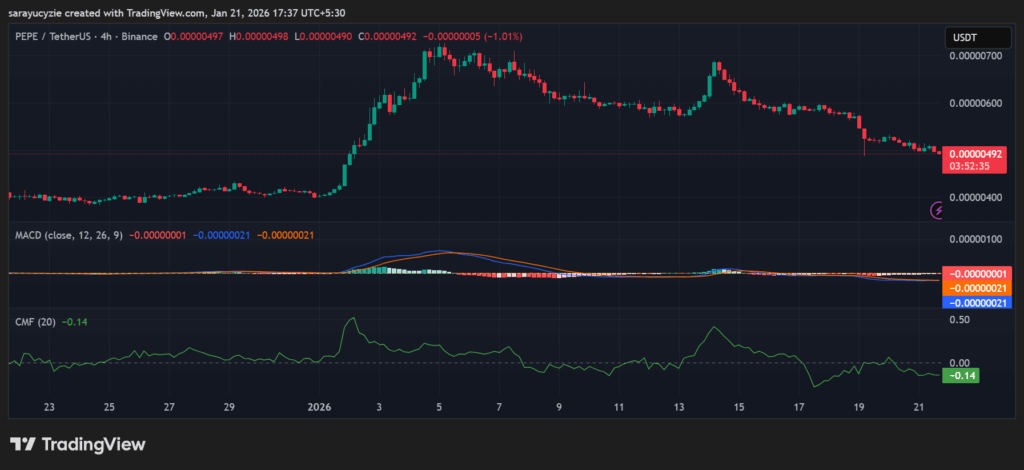
PEPE chart (Source: TradingView)

Moreover, the Chaikin Money Flow (CMF) indicator, which settled at 0.14, exhibits buying pressure in the meme coin market. Also, the capital inflows are slightly exceeding outflows, showing accumulation rather than distribution, whereas the momentum is not strong. 

PEPE’s market sentiment is in the oversold territory, as the daily Relative Strength Index (RSI) is at 26.88. This value suggests a strong selling pressure, and as the downtrend remains, it can signal a potential short-term bounce if buyers step in. Besides, the Bull Bear Power (BBP) reading of -0.00000040 indicates that bears mildly dominate. It points to weak downside momentum, and the market is close to neutral rather than strongly bearish.

Top Updated Crypto News

Chainlink (LINK) at a Make-or-Break Zone: Which Side Wins the $15 vs $10 Battle?

Market Opportunity
BULLS Logo
BULLS Price(BULLS)
$322.93
$322.93$322.93
+0.31%
USD
BULLS (BULLS) Live Price Chart
Disclaimer: The articles reposted on this site are sourced from public platforms and are provided for informational purposes only. They do not necessarily reflect the views of MEXC. All rights remain with the original authors. If you believe any content infringes on third-party rights, please contact crypto.news@mexc.com for removal. MEXC makes no guarantees regarding the accuracy, completeness, or timeliness of the content and is not responsible for any actions taken based on the information provided. The content does not constitute financial, legal, or other professional advice, nor should it be considered a recommendation or endorsement by MEXC.

You May Also Like

Today’s Biggest Crypto Movers: Dogecoin Leads the Pack

Today’s Biggest Crypto Movers: Dogecoin Leads the Pack

Today's Biggest Crypto Movers: Dogecoin Leads the Pack 🚀 Crypto Markets Heat Up Today Major cryptocurrencies are showing strong gains. Let's dive into today's top
Share
Blockchainmagazine2026/04/03 13:00
RWA Boom Accelerates As Tokenized Assets Hit New Highs In Early 2026

RWA Boom Accelerates As Tokenized Assets Hit New Highs In Early 2026

RWA distributed value rose from about $21B to $27.5B in Q1 2026, a gain of roughly 30%. Tokenized US Treasuries reached about $10B, creating an on-chain yield base
Share
LiveBitcoinNews2026/04/03 13:00
Cryptos Signal Divergence Ahead of Fed Rate Decision

Cryptos Signal Divergence Ahead of Fed Rate Decision

The post Cryptos Signal Divergence Ahead of Fed Rate Decision appeared on BitcoinEthereumNews.com. Crypto assets send conflicting signals ahead of the Federal Reserve’s September rate decision. On-chain data reveals a clear decrease in Bitcoin and Ethereum flowing into centralized exchanges, but a sharp increase in altcoin inflows. The findings come from a Tuesday report by CryptoQuant, an on-chain data platform. The firm’s data shows a stark divergence in coin volume, which has been observed in movements onto centralized exchanges over the past few weeks. Bitcoin and Ethereum Inflows Drop to Multi-Month Lows Sponsored Sponsored Bitcoin has seen a dramatic drop in exchange inflows, with the 7-day moving average plummeting to 25,000 BTC, its lowest level in over a year. The average deposit per transaction has fallen to 0.57 BTC as of September. This suggests that smaller retail investors, rather than large-scale whales, are responsible for the recent cash-outs. Ethereum is showing a similar trend, with its daily exchange inflows decreasing to a two-month low. CryptoQuant reported that the 7-day moving average for ETH deposits on exchanges is around 783,000 ETH, the lowest in two months. Other Altcoins See Renewed Selling Pressure In contrast, other altcoin deposit activity on exchanges has surged. The number of altcoin deposit transactions on centralized exchanges was quite steady in May and June of this year, maintaining a 7-day moving average of about 20,000 to 30,000. Recently, however, that figure has jumped to 55,000 transactions. Altcoins: Exchange Inflow Transaction Count. Source: CryptoQuant CryptoQuant projects that altcoins, given their increased inflow activity, could face relatively higher selling pressure compared to BTC and ETH. Meanwhile, the balance of stablecoins on exchanges—a key indicator of potential buying pressure—has increased significantly. The report notes that the exchange USDT balance, around $273 million in April, grew to $379 million by August 31, marking a new yearly high. CryptoQuant interprets this surge as a reflection of…
Share
BitcoinEthereumNews2025/09/18 01:01

Trade GOLD, Share 1,000,000 USDT

Trade GOLD, Share 1,000,000 USDTTrade GOLD, Share 1,000,000 USDT

0 fees, up to 1,000x leverage, deep liquidity