The post Why Monero Is Dumping Today—Here’s What to Expect from XMR Price Rally appeared first on Coinpedia Fintech News The Monero price experienced quick gainsThe post Why Monero Is Dumping Today—Here’s What to Expect from XMR Price Rally appeared first on Coinpedia Fintech News The Monero price experienced quick gains

Why Monero Is Dumping Today—Here’s What to Expect from XMR Price Rally

After Dash and ZCash, Is Monero the Next Privacy Coin Set to Surge

The post Why Monero Is Dumping Today—Here’s What to Expect from XMR Price Rally appeared first on Coinpedia Fintech News

The Monero price experienced quick gains, with the volume growing more than 400% to 500% and marked new highs close to $800. However, in the times when the price was believed to smash the psychological resistance at $1000, the bears hit the markets and slashed the price hard. Currently, the token is seeing a sharp pullback today after a strong, fast rally that pushed the XMR price into overheated territory. 

The sudden reversal has caught late buyers off guard, and the speed of the decline suggests this isn’t just a slow drift lower. 

The drastic rise in the price to the ATH seems to have attracted the bears, triggering profit-taking. However, the volume sustains above the average zone, hinting towards the rising volatility within the platform. This could keep the traders on their feet; as a result, a small rebound could attract massive buying pressure, raising the price levels back into the demand area. 

Monero Price Analysis: What XMR/USDT Charts Say

The XMR price surged significantly in the past few days, which is helping the bulls to digest the ongoing selling pressure. The token remains within the bullish range and hence flashes the possibility of a rebound. Although the token has lost over 30% gains in the past few days, the price remains within a bullish range, displaying a strong possibility of a reversal with an aim to mark fresh highs. 

xmr price

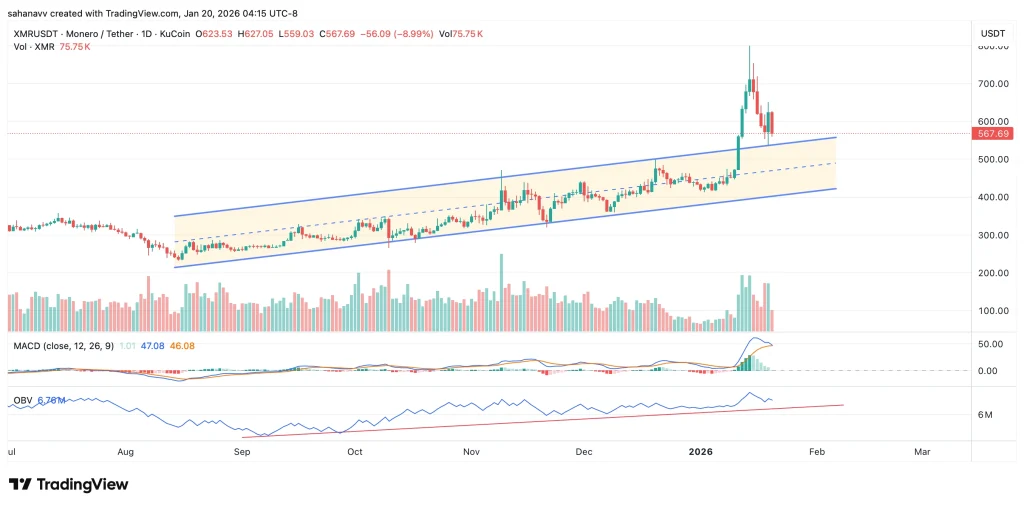
As seen in the above chart, the Monero price has been rising steadily within a rising parallel channel before a bullish breakout to new highs. The bulls are defending the support at the resistance of the channel, and until the price remains above this range, the possibility of a strong bounce could persist. The MACD is about to undergo a bearish crossover, hinting towards a deeper correction; however, OBV remains elevated. The levels are rising along the increasing trend line, which is acting as a support, flashing bullish signals for the crypto. 

What’s next for Monero? Will it Reach $1000?

Today’s move looks like a cooldown after a rapid rally. Monero is now testing whether that surge built a real base or was just a short-lived spike. If buyers defend support and the price starts consolidating, XMR can rebound. If support breaks, the pullback may deepen as the market searches for stronger demand. Volatility should stay high over the next few sessions.

Despite this, Monero can still reach $1,000, but not because of today’s drop. This looks like an overheated rally unwinding. XMR must stabilize, reclaim key resistance, and retest recent highs. If it fails, the correction extends and delays the $1,000 target.

Market Opportunity
Monero Logo
Monero Price(XMR)
$503.87
$503.87$503.87
-6.84%
USD
Monero (XMR) Live Price Chart
Disclaimer: The articles reposted on this site are sourced from public platforms and are provided for informational purposes only. They do not necessarily reflect the views of MEXC. All rights remain with the original authors. If you believe any content infringes on third-party rights, please contact service@support.mexc.com for removal. MEXC makes no guarantees regarding the accuracy, completeness, or timeliness of the content and is not responsible for any actions taken based on the information provided. The content does not constitute financial, legal, or other professional advice, nor should it be considered a recommendation or endorsement by MEXC.

You May Also Like

Microsoft Corp. $MSFT blue box area offers a buying opportunity

Microsoft Corp. $MSFT blue box area offers a buying opportunity

The post Microsoft Corp. $MSFT blue box area offers a buying opportunity appeared on BitcoinEthereumNews.com. In today’s article, we’ll examine the recent performance of Microsoft Corp. ($MSFT) through the lens of Elliott Wave Theory. We’ll review how the rally from the April 07, 2025 low unfolded as a 5-wave impulse followed by a 3-swing correction (ABC) and discuss our forecast for the next move. Let’s dive into the structure and expectations for this stock. Five wave impulse structure + ABC + WXY correction $MSFT 8H Elliott Wave chart 9.04.2025 In the 8-hour Elliott Wave count from Sep 04, 2025, we saw that $MSFT completed a 5-wave impulsive cycle at red III. As expected, this initial wave prompted a pullback. We anticipated this pullback to unfold in 3 swings and find buyers in the equal legs area between $497.02 and $471.06 This setup aligns with a typical Elliott Wave correction pattern (ABC), in which the market pauses briefly before resuming its primary trend. $MSFT 8H Elliott Wave chart 7.14.2025 The update, 10 days later, shows the stock finding support from the equal legs area as predicted allowing traders to get risk free. The stock is expected to bounce towards 525 – 532 before deciding if the bounce is a connector or the next leg higher. A break into new ATHs will confirm the latter and can see it trade higher towards 570 – 593 area. Until then, traders should get risk free and protect their capital in case of a WXY double correction. Conclusion In conclusion, our Elliott Wave analysis of Microsoft Corp. ($MSFT) suggested that it remains supported against April 07, 2025 lows and bounce from the blue box area. In the meantime, keep an eye out for any corrective pullbacks that may offer entry opportunities. By applying Elliott Wave Theory, traders can better anticipate the structure of upcoming moves and enhance risk management in volatile markets. Source: https://www.fxstreet.com/news/microsoft-corp-msft-blue-box-area-offers-a-buying-opportunity-202509171323
Share
BitcoinEthereumNews2025/09/18 03:50
WTI drifts higher above $59.50 on Kazakh supply disruptions

WTI drifts higher above $59.50 on Kazakh supply disruptions

The post WTI drifts higher above $59.50 on Kazakh supply disruptions appeared on BitcoinEthereumNews.com. West Texas Intermediate (WTI), the US crude oil benchmark
Share
BitcoinEthereumNews2026/01/21 11:24
MYX Finance price surges again as funding rate points to a crash

MYX Finance price surges again as funding rate points to a crash

MYX Finance price went parabolic again as the recent short-squeeze resumed. However, the formation of a double-top pattern and the funding rate point to an eventual crash in the coming days. MYX Finance (MYX) came in the spotlight earlier this…
Share
Crypto.news2025/09/18 02:57