

CryptoQuant: Fear and Greed Index Signals Potential Rally
- CryptoQuant has recorded a “golden cross” in the fear and greed index.
- The historical pattern signals a potential continuation of the bull trend
- The 30-day average rose above the 90-day average for the first time since May 2025.
- This points to a shift in short-term sentiment amid market skepticism.
CryptoQuant analysts reported the formation of a potentially important market signal. They are referring to a “golden cross” in the moving averages of the bitcoin fear and greed index.
According to them, for the first time since May 2025, the 30-day moving average crossed above the 90-day moving average, which has historically indicated a shift in sentiment toward “bullish” conditions.
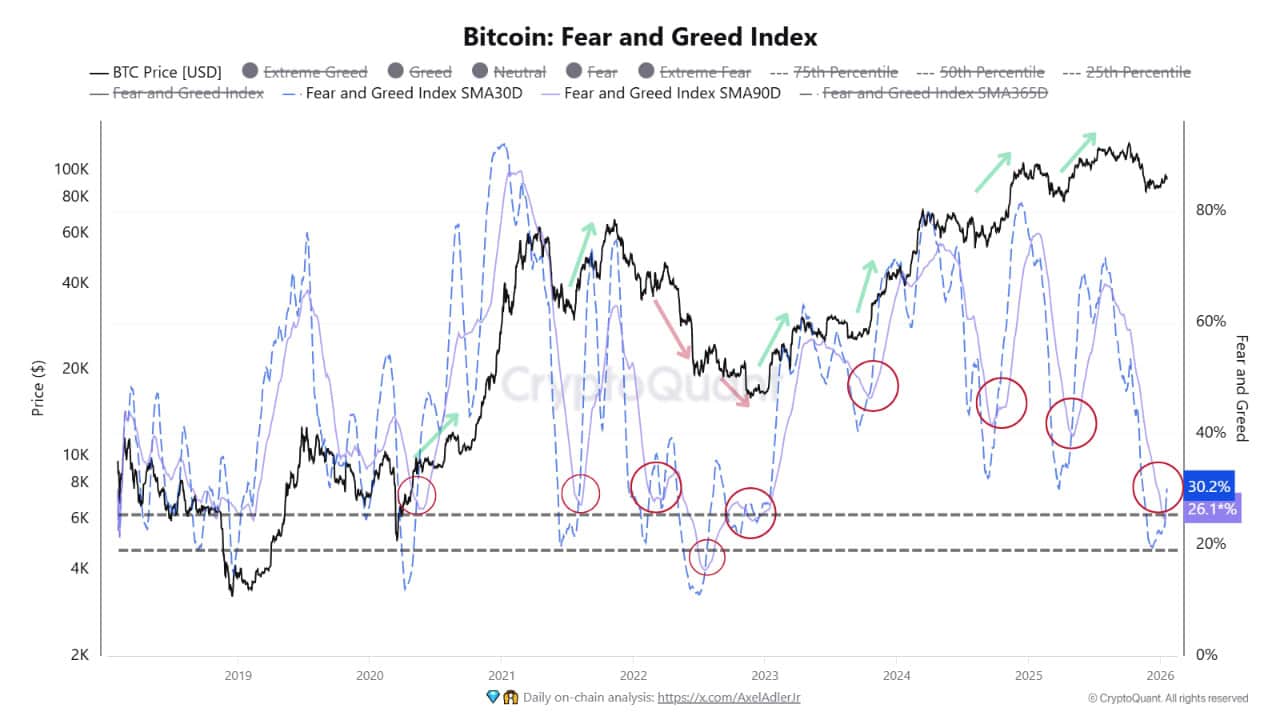 Fear and greed index. Data: CryptoQuant.
As the experts noted, this kind of behavior suggests that short-term sentiment is improving faster than the long-term trend. This does not indicate euphoria. On the contrary — the signal typically forms amid skepticism, persistently high volatility, and fragile market confidence, the statement said.
CryptoQuant emphasized that what matters is not the absolute level of fear or greed, but the momentum of sentiment relative to the underlying trend.
According to the analysts, the signal becomes stronger if the crossover is accompanied by the formation of “higher lows” on the price chart and the absence of aggressive selling pressure.
Experts believe that a widening gap between the 30-day and 90-day moving averages points to the start of an uptrend, while a crossover signals the risk of defensive selling driven by superficial optimism.
Notably, as of the time of writing, the Fear and Greed Index stands at 32 points, indicating “fear” among traders. Previously, the indicator reached its highest level since the market crash in October.


You May Also Like

Bybit Unveils AI Sub-Accounts for Safer Automated Crypto Trading

Fed Governor Calls For Strong Stablecoin Oversight As CLARITY Act’s Final Text Gets Delayed

How to Spot a South African Cyber-Scam Before You Click “Pay”


