Solana (SOL) Slips Back to Support, Setting Up a High-Tension Test
Solana failed to stay above $146 and corrected gains. SOL price is now trading below $145 and might find bids near the $140 zone.
- SOL price started a downside correction below $145 against the US Dollar.
- The price is now trading below $145 and the 100-hourly simple moving average.
- There is a bullish trend line forming with support at $141 on the hourly chart of the SOL/USD pair (data source from Kraken).
- The pair could extend losses if it dips below the $140 zone.
Solana Price Starts Downside Correction
Solana price failed to surpass $150 and started a downside correction, like Bitcoin and Ethereum. SOL dipped below $146 and $145 to enter a short-term bearish zone.
There was a move below the 61.8% Fib retracement level of the upward wave from the $138 swing low to the $149 high. However, the bulls are active above $140. Besides, there is a bullish trend line forming with support at $141 on the hourly chart of the SOL/USD pair.
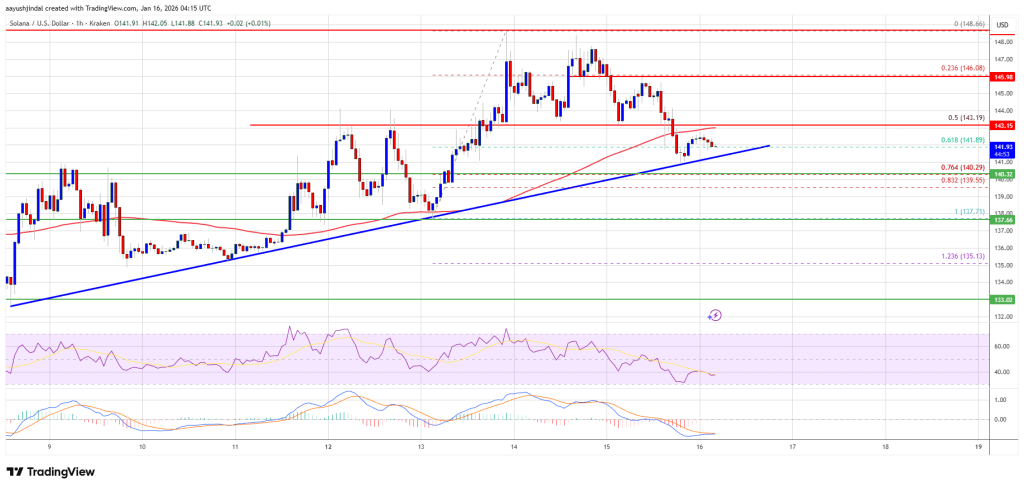
Solana is now trading below $145 and the 100-hourly simple moving average. On the upside, the price is facing resistance near the $144 level. The next major resistance is near the $146 level. The main resistance could be $148. A successful close above the $148 resistance zone could set the pace for another steady increase. The next key resistance is $155. Any more gains might send the price toward the $162 level.
More Losses In SOL?
If SOL fails to rise above the $146 resistance, it could start another decline. Initial support on the downside is near the $141 zone and the trend line. The first major support is near the $140 level and the 76.4% Fib retracement level of the upward wave from the $138 swing low to the $149 high.
A break below the $140 level might send the price toward the $132 support zone. If there is a close below the $132 support, the price could decline toward the $124 support in the near term.
Technical Indicators
Hourly MACD – The MACD for SOL/USD is gaining pace in the bearish zone.
Hourly Hours RSI (Relative Strength Index) – The RSI for SOL/USD is below the 50 level.
Major Support Levels – $141 and $140.
Major Resistance Levels – $146 and $148.
You May Also Like

Wormhole launches reserve tying protocol revenue to token

Wormhole Unleashes W 2.0 Tokenomics for a Connected Blockchain Future