

XMR Surges to $500 for First Time Since 2021 as Zcash Declines
Monero Surpasses $500 Amid Broader Privacy Coin Market Turmoil
Monero, the leading privacy-focused cryptocurrency, has broken past the $500 threshold for the first time since its peak in May 2021, signaling renewed investor interest. The digital asset briefly touched $500.66 after a 6% rise on Sunday and a 20% increase over the past week, approaching its all-time high of approximately $517.50 established in April 2021. This uptick reflects Monero’s growing appeal amid turbulence affecting its privacy coin rivals.
XMR/USD daily chart. Source: TradingViewZcash Fiasco Spurs Monero’s Rally
The recent rally in Monero contrasts sharply with the challenging developments within the Zcash community. On Wednesday, the team behind Zcash, Electric Coin Company, faced a mass resignation due to disputes over project governance, asset management, and operational direction. The fallout uncovered significant internal rifts, especially concerning the management of vital project assets and strategic governance. Subsequently, Zcash’s price plummeted over 20%, reaching a weekly low of around $360 amid market uncertainty.
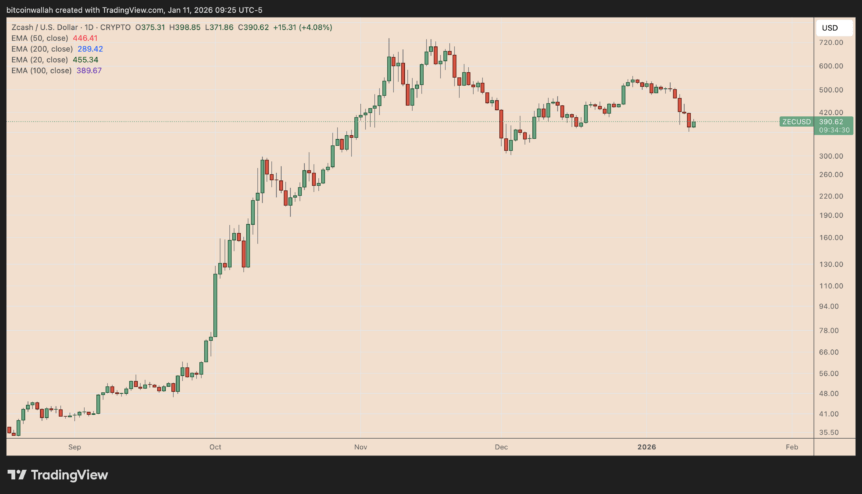 ZEC/USD daily chart. TradingView
Meanwhile, institutional commentary has been notably bullish on Monero. Leading investment firms such as Grayscale and Coinbase highlighted privacy coins as a critical growth theme, emphasizing rising demand for financial confidentiality in increasingly regulated markets.
With the turmoil surrounding Zcash, traders have shown a preference for Monero, viewing it as the more reliable and comprehensive privacy solution in the current climate.
Technical Outlook: Caution on the Horizon
As of January, Monero was nearing a pivotal point, eyeing a breakout above its previous high of approximately $517.50. Historically, similar breakout attempts have failed seven times in the past, often resulting in sharp corrections of 40% to 95%, pulling the price down toward support levels along an ascending trendline.
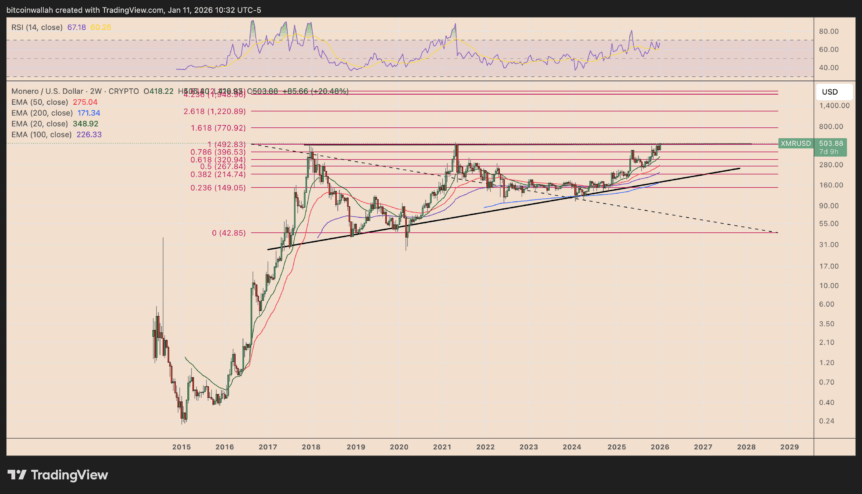 XMR/USD two-week chart. Source: TradingView
Such historical patterns suggest that a sustained upward move above $500-$520 must be confirmed to invalidate the bearish fractal and open the door to further gains. Success could see the asset rallying towards $775, bringing it to new all-time highs, similar to other cryptocurrencies that broke out after prolonged consolidation phases in 2025.
This analysis underscores the importance of cautious optimism — while Monero’s fundamentals appear strong amid this rally, historical fractals highlight potential risks of a significant correction if the resistance fails to hold.
This article is for informational purposes only and does not constitute financial advice. Cryptocurrency investments carry risks, and readers are advised to conduct their own research prior to making trading decisions. The information provided is not guaranteed to be accurate or complete, and reliance on such data is at the reader’s own risk.
This article was originally published as XMR Surges to $500 for First Time Since 2021 as Zcash Declines on Crypto Breaking News – your trusted source for crypto news, Bitcoin news, and blockchain updates.


You May Also Like
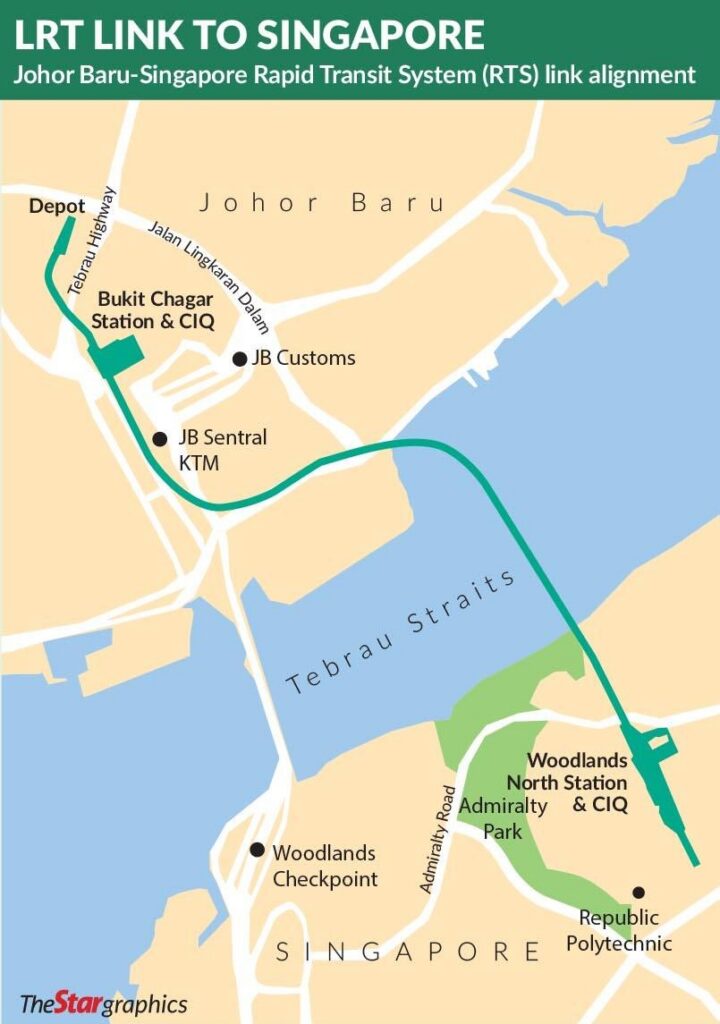
RTS Link Singapore–JB (2026): Fares, Stations & Opening

Sterling Weakens As Dollar Soars On Geopolitical Escalation And Bailey’s Cautious Stance


