PUMP’s push above its 20-day average comes as trading volumes and platform activity spike, but the move still lacks a clear trend reversal pattern. PUMP was tradingPUMP’s push above its 20-day average comes as trading volumes and platform activity spike, but the move still lacks a clear trend reversal pattern. PUMP was trading

PUMP price breaks above 20-day average as memecoin trading heats up

PUMP’s push above its 20-day average comes as trading volumes and platform activity spike, but the move still lacks a clear trend reversal pattern.

Summary
  • PUMP price is up 30% in seven days but remains deeply below its September peak.
  • Rising spot and derivatives volume point to active trading, not leverage buildup.
  • Technical indicators suggest a relief bounce, with resistance still overhead.

PUMP was trading at $0.00249 at press time, up 1.3% over the past 24 hours despite crypto market weakness. The token has gained roughly 30% over the last seven days, even as it remains down 17% on the month and nearly 71% below its all-time high of $0.00881 set in September.

Trading activity expanded alongside the recovery. Spot volume reached $182 million in the last 24 hours, a 30% increase, pointing to stronger participation rather than a thin liquidity bounce.

Derivatives data from CoinGlass shows a similar pattern. Futures volume climbed 29% to $101 million, while open interest rose a modest 1.9% to $64 million. 

Platform activity surges

The recent price recovery has has been triggered by a sharp pickup in Pump.fun’s (PUMP) on-chain activity. Dune Analytics data shows daily trading volume reached $116 million on Dec. 6, a clear improvement from the $60–80 million range that dominated through December and early January.

Daily active addresses have climbed to 135,242, the highest level in months, while 24-hour protocol revenue hit $2.67 million.

The platform’s longer-term numbers are striking. Pump.fun brought in just under $1 billion in revenue in 2025, with a large share of that coming in the final quarter. A significant portion of those funds, a little over $200 million, has been directed toward buying back PUMP tokens. This has taken about 10% of the supply out of circulation and helped support a deflationary setup.

Even with those numbers, the project isn’t without issues. Pump.fun is dealing with the possibility of a lawsuit that could reach around $500 million, and it has faced ongoing backlash over reports that the vast majority of tokens launched on the platform end up as rug pulls.

PUMP price technical analysis

The overall picture is still leaning bearish to neutral. For months, PUMP has been trapped in a pattern of lower highs and lower lows, and the most recent push higher appears to be more of a temporary bounce than the beginning of a true trend shift.

The Bollinger Bands show price bouncing off the lower range. That said, the bands aren’t widening much, suggesting momentum is still muted.

PUMP price breaks above 20-day average as memecoin trading heats up - 1

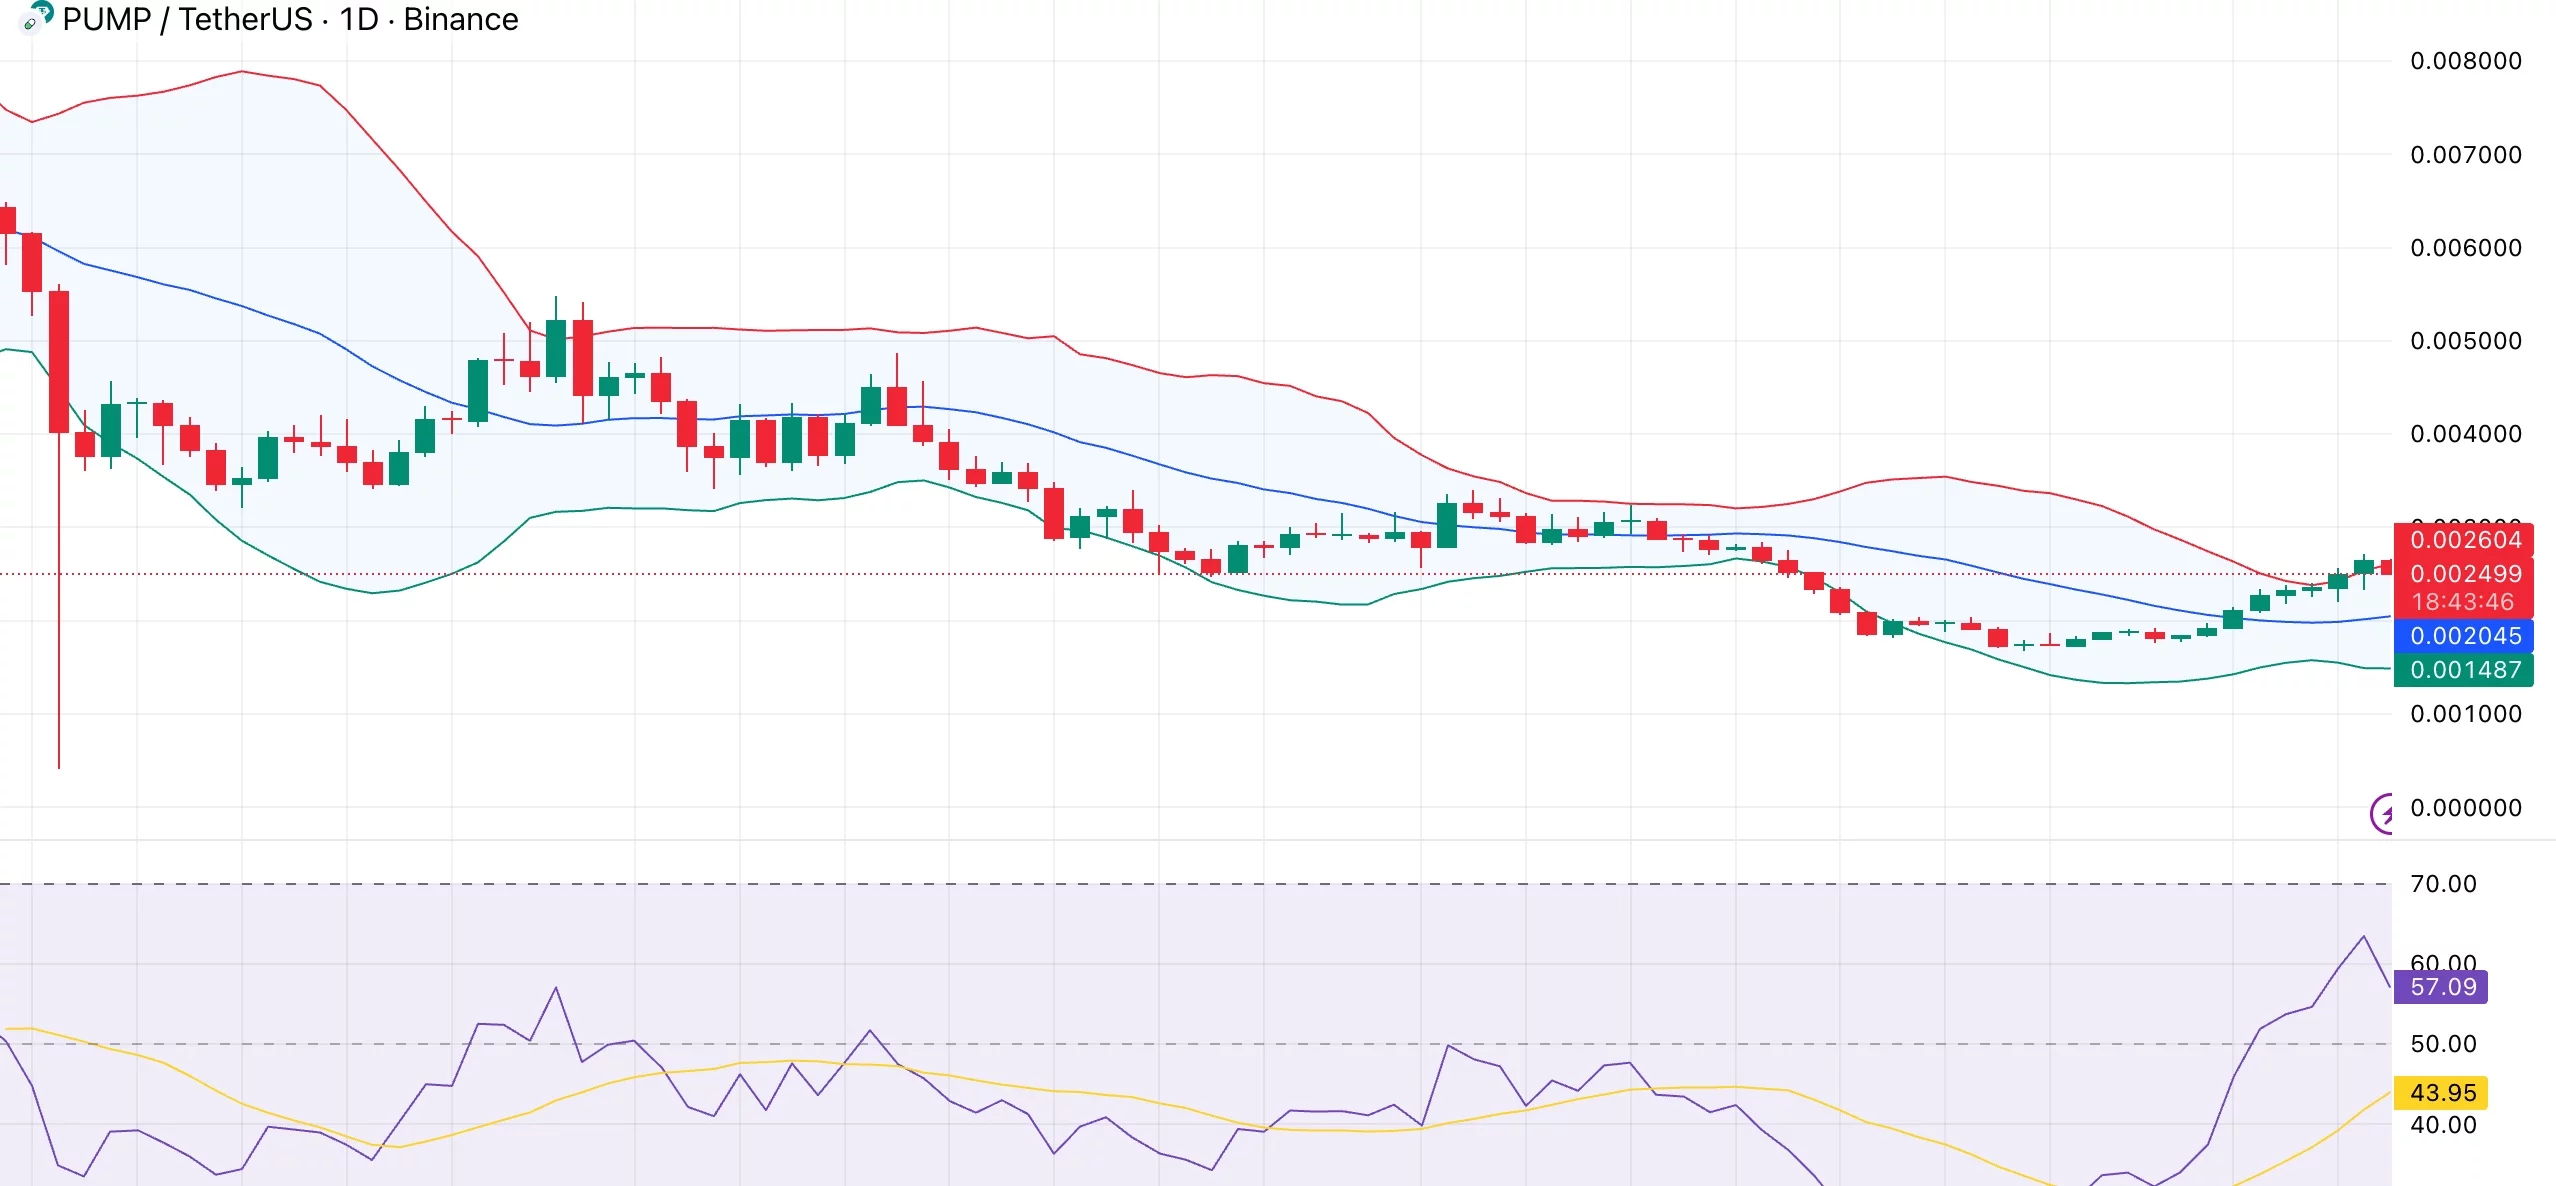
Price is now pressing up against the 20-day moving average from below, and that average is still trending downward. A clear daily close above it, with continued strength, would be a constructive sign. If the price gets rejected here, it would likely confirm that the broader bearish structure is still in place.

Conflicting signals are coming from momentum. After emerging from oversold territory, the relative strength index has risen back to the mid-50s, indicating some improvement in strength. However, in weaker markets, rallies often stall in this area.

Support on the downside is located between $0.0020 and $0.0021, with a stronger floor near $0.0015. Resistance is between $0.0026 and $0.0027, followed by a wider supply area around $0.003.

If PUMP can hold above $0.0025 and reclaim short-term moving averages, the price could extend toward the $0.003 area. Failure to maintain current levels would likely refocus attention on the $0.002 support zone, keeping the broader downtrend in place.

Market Opportunity
pump.fun Logo
pump.fun Price(PUMP)
$0.0023
$0.0023$0.0023
-4.40%
USD
pump.fun (PUMP) Live Price Chart
Disclaimer: The articles reposted on this site are sourced from public platforms and are provided for informational purposes only. They do not necessarily reflect the views of MEXC. All rights remain with the original authors. If you believe any content infringes on third-party rights, please contact service@support.mexc.com for removal. MEXC makes no guarantees regarding the accuracy, completeness, or timeliness of the content and is not responsible for any actions taken based on the information provided. The content does not constitute financial, legal, or other professional advice, nor should it be considered a recommendation or endorsement by MEXC.

You May Also Like

American Bitcoin’s $5B Nasdaq Debut Puts Trump-Backed Miner in Crypto Spotlight

American Bitcoin’s $5B Nasdaq Debut Puts Trump-Backed Miner in Crypto Spotlight

The post American Bitcoin’s $5B Nasdaq Debut Puts Trump-Backed Miner in Crypto Spotlight appeared on BitcoinEthereumNews.com. Key Takeaways: American Bitcoin (ABTC) surged nearly 85% on its Nasdaq debut, briefly reaching a $5B valuation. The Trump family, alongside Hut 8 Mining, controls 98% of the newly merged crypto-mining entity. Eric Trump called Bitcoin “modern-day gold,” predicting it could reach $1 million per coin. American Bitcoin, a fast-rising crypto mining firm with strong political and institutional backing, has officially entered Wall Street. After merging with Gryphon Digital Mining, the company made its Nasdaq debut under the ticker ABTC, instantly drawing global attention to both its stock performance and its bold vision for Bitcoin’s future. Read More: Trump-Backed Crypto Firm Eyes Asia for Bold Bitcoin Expansion Nasdaq Debut: An Explosive First Day ABTC’s first day of trading proved as dramatic as expected. Shares surged almost 85% at the open, touching a peak of $14 before settling at lower levels by the close. That initial spike valued the company around $5 billion, positioning it as one of 2025’s most-watched listings. At the last session, ABTC has been trading at $7.28 per share, which is a small positive 2.97% per day. Although the price has decelerated since opening highs, analysts note that the company has been off to a strong start and early investor activity is a hard-to-find feat in a newly-launched crypto mining business. According to market watchers, the listing comes at a time of new momentum in the digital asset markets. With Bitcoin trading above $110,000 this quarter, American Bitcoin’s entry comes at a time when both institutional investors and retail traders are showing heightened interest in exposure to Bitcoin-linked equities. Ownership Structure: Trump Family and Hut 8 at the Helm Its management and ownership set up has increased the visibility of the company. The Trump family and the Canadian mining giant Hut 8 Mining jointly own 98 percent…
Share
BitcoinEthereumNews2025/09/18 01:33
BBNX Investors Have Opportunity to Join Beta Bionics, Inc. Fraud Investigation with the Schall Law Firm

BBNX Investors Have Opportunity to Join Beta Bionics, Inc. Fraud Investigation with the Schall Law Firm

LOS ANGELES–(BUSINESS WIRE)–$BBNX—The Schall Law Firm, a national shareholder rights litigation firm, announces that it is investigating claims on behalf of investors
Share
AI Journal2026/01/11 06:30
Microsoft Corp. $MSFT blue box area offers a buying opportunity

Microsoft Corp. $MSFT blue box area offers a buying opportunity

The post Microsoft Corp. $MSFT blue box area offers a buying opportunity appeared on BitcoinEthereumNews.com. In today’s article, we’ll examine the recent performance of Microsoft Corp. ($MSFT) through the lens of Elliott Wave Theory. We’ll review how the rally from the April 07, 2025 low unfolded as a 5-wave impulse followed by a 3-swing correction (ABC) and discuss our forecast for the next move. Let’s dive into the structure and expectations for this stock. Five wave impulse structure + ABC + WXY correction $MSFT 8H Elliott Wave chart 9.04.2025 In the 8-hour Elliott Wave count from Sep 04, 2025, we saw that $MSFT completed a 5-wave impulsive cycle at red III. As expected, this initial wave prompted a pullback. We anticipated this pullback to unfold in 3 swings and find buyers in the equal legs area between $497.02 and $471.06 This setup aligns with a typical Elliott Wave correction pattern (ABC), in which the market pauses briefly before resuming its primary trend. $MSFT 8H Elliott Wave chart 7.14.2025 The update, 10 days later, shows the stock finding support from the equal legs area as predicted allowing traders to get risk free. The stock is expected to bounce towards 525 – 532 before deciding if the bounce is a connector or the next leg higher. A break into new ATHs will confirm the latter and can see it trade higher towards 570 – 593 area. Until then, traders should get risk free and protect their capital in case of a WXY double correction. Conclusion In conclusion, our Elliott Wave analysis of Microsoft Corp. ($MSFT) suggested that it remains supported against April 07, 2025 lows and bounce from the blue box area. In the meantime, keep an eye out for any corrective pullbacks that may offer entry opportunities. By applying Elliott Wave Theory, traders can better anticipate the structure of upcoming moves and enhance risk management in volatile markets. Source: https://www.fxstreet.com/news/microsoft-corp-msft-blue-box-area-offers-a-buying-opportunity-202509171323
Share
BitcoinEthereumNews2025/09/18 03:50