TLDR SOL price breaks a four-month downtrend, reclaiming the $134 level on rising volume. Weekly structure improves as buyers defend key support near $115. IntradayTLDR SOL price breaks a four-month downtrend, reclaiming the $134 level on rising volume. Weekly structure improves as buyers defend key support near $115. Intraday

Solana Price Analysis: SOL Breaks Downtrend as Bull Reversal Targets $150

TLDR

  • SOL price breaks a four-month downtrend, reclaiming the $134 level on rising volume.
  • Weekly structure improves as buyers defend key support near $115.
  • Intraday charts favor continuation if SOL holds above $134 on a daily close.
  • Clearing $144 resistance could open upside toward the $150 target zone.

Solana (SOL) price entered 2026 with renewed upside momentum after breaking a multi-month downtrend. Technical analysts highlight improving structure across several timeframes, supported by rising volume. If current levels hold, price action points toward a potential move into the $144–$150 resistance zone.

Solana Price Breaks Weekly Downtrend Resistance

According to analyst Rand, the weekly Solana price chart shows a decisive break above a four-month descending resistance line. Price reclaimed the $134 area in early January after trending lower from mid-2025 highs near $200. This move marked the first sustained shift in weekly structure since the correction began.

ImageSOURCE: X

The breakout occurred alongside improving volume conditions following the holiday period. Weekly candles suggest buyers are regaining control after defending the $115 support zone. Horizontal resistance levels remain at $144 and $150, which previously capped upside attempts.

Moreover, the weekly structure reflects resilience after prolonged consolidation. Holding above the former trendline favors continuation toward higher resistance. A loss of $134 would instead expose a retest of the $120 region.

Intraday Structure Supports Continuation Above $134

Meanwhile, according to analyst Harry, the four-hour SOL perpetual futures chart shows constructive price behavior. Solana price rebounded sharply from $115 and stabilized above $130, challenging the former trendline resistance. January candles indicate reduced downside volatility compared to December.

ImageSOURCE: X

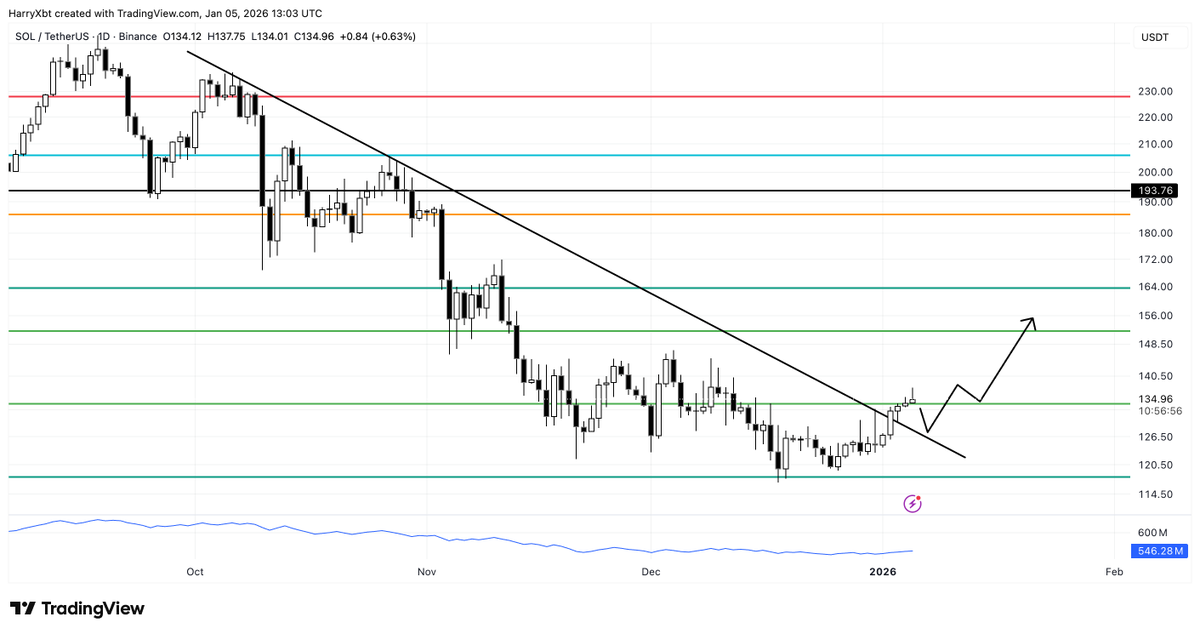
This stabilization suggests accumulation rather than reactive buying. The ability to hold above $134 on a daily close is viewed as critical confirmation. Such a close would signal acceptance above resistance and unlock higher targets.

In addition, the intraday structure reflects improving momentum conditions. If price sustains above the breakout level, a measured move toward $150 becomes feasible. Failure to maintain this zone would likely lead to renewed consolidation near $125.

Falling Wedge Breakout Puts Focus on $144 Sell Wall

In addition, analyst DonnieBTC highlighted a falling wedge pattern that has guided price action since November. Solana compressed within this structure after declining from $160, before rebounding toward the upper boundary. The recent test near $134 places the price at a critical decision point.

Falling wedges typically resolve higher when downside momentum fades. The chart identifies $144 as a notable sell wall that could slow upside progress. Clearing this level would confirm strength and shift focus toward the $150 region.

ImageSOURCE: X

Furthermore, higher-timeframe alignment supports a bullish bias if resistance gives way. Sustained trade above the wedge would suggest a broader trend reversal. Rejection at resistance would delay continuation but keep the recovery structure intact.

The post Solana Price Analysis: SOL Breaks Downtrend as Bull Reversal Targets $150 appeared first on CoinCentral.

Market Opportunity
Solana Logo
Solana Price(SOL)
$138.3
$138.3$138.3
-3.00%
USD
Solana (SOL) Live Price Chart
Disclaimer: The articles reposted on this site are sourced from public platforms and are provided for informational purposes only. They do not necessarily reflect the views of MEXC. All rights remain with the original authors. If you believe any content infringes on third-party rights, please contact service@support.mexc.com for removal. MEXC makes no guarantees regarding the accuracy, completeness, or timeliness of the content and is not responsible for any actions taken based on the information provided. The content does not constitute financial, legal, or other professional advice, nor should it be considered a recommendation or endorsement by MEXC.

You May Also Like

Microsoft Corp. $MSFT blue box area offers a buying opportunity

Microsoft Corp. $MSFT blue box area offers a buying opportunity

The post Microsoft Corp. $MSFT blue box area offers a buying opportunity appeared on BitcoinEthereumNews.com. In today’s article, we’ll examine the recent performance of Microsoft Corp. ($MSFT) through the lens of Elliott Wave Theory. We’ll review how the rally from the April 07, 2025 low unfolded as a 5-wave impulse followed by a 3-swing correction (ABC) and discuss our forecast for the next move. Let’s dive into the structure and expectations for this stock. Five wave impulse structure + ABC + WXY correction $MSFT 8H Elliott Wave chart 9.04.2025 In the 8-hour Elliott Wave count from Sep 04, 2025, we saw that $MSFT completed a 5-wave impulsive cycle at red III. As expected, this initial wave prompted a pullback. We anticipated this pullback to unfold in 3 swings and find buyers in the equal legs area between $497.02 and $471.06 This setup aligns with a typical Elliott Wave correction pattern (ABC), in which the market pauses briefly before resuming its primary trend. $MSFT 8H Elliott Wave chart 7.14.2025 The update, 10 days later, shows the stock finding support from the equal legs area as predicted allowing traders to get risk free. The stock is expected to bounce towards 525 – 532 before deciding if the bounce is a connector or the next leg higher. A break into new ATHs will confirm the latter and can see it trade higher towards 570 – 593 area. Until then, traders should get risk free and protect their capital in case of a WXY double correction. Conclusion In conclusion, our Elliott Wave analysis of Microsoft Corp. ($MSFT) suggested that it remains supported against April 07, 2025 lows and bounce from the blue box area. In the meantime, keep an eye out for any corrective pullbacks that may offer entry opportunities. By applying Elliott Wave Theory, traders can better anticipate the structure of upcoming moves and enhance risk management in volatile markets. Source: https://www.fxstreet.com/news/microsoft-corp-msft-blue-box-area-offers-a-buying-opportunity-202509171323
Share
BitcoinEthereumNews2025/09/18 03:50
Bhutanese government transfers 343.1 Bitcoins and may deposit them again on CEX

Bhutanese government transfers 343.1 Bitcoins and may deposit them again on CEX

PANews reported on September 18 that according to Onchain Lens , the Royal Government of Bhutan has transferred 343.1 bitcoins (approximately US$ 40.18 million) to a new wallet and is expected to deposit the funds into a centralized exchange ( CEX ) as in the past.
Share
PANews2025/09/18 17:22
GitHub Copilot Gets Smarter With Context Engineering Techniques

GitHub Copilot Gets Smarter With Context Engineering Techniques

The post GitHub Copilot Gets Smarter With Context Engineering Techniques appeared on BitcoinEthereumNews.com. Peter Zhang Jan 12, 2026 23:03 GitHub reveals
Share
BitcoinEthereumNews2026/01/13 09:29