Bitcoin (BTC) Price Surges to $93,000: Key Resistance Test – Bullish Breakout or Pullback? January 5 TA
The Bitcoin price has been surging since breaking out of a huge falling wedge pattern. However, $BTC has now come up against a major horizontal resistance level at $93,000. Do the bulls still have enough in the tank to break through, or is this a perfect place for a rejection?
$BTC overbought: can bulls still break out?
Source: TradingView
The 4-hour time frame for $BTC shows how the price has finally begun to angle upward after passing through the downtrend line, while using the major ascending trendline as a base.
Nevertheless, a major horizontal resistance level was waiting at around $93,500, where it appears the price has met with rejection. There is still a chance that the bulls could make another huge effort and break up and beyond this horizontal line, but given that $BTC is overbought on all the short time frames up to the daily, it would make sense for the next reversal phase to kick in now.
A possible factor for a continuation of the rally is how far down the price will drop. If the price comes back to the major ascending trendline and dips below it again, things will be pretty much back to where they were in these last several weeks of sideways up and down chop.
However, if the price only makes a shallow dip, perhaps coming back to retest $90,000, and confirming it as support, the rally may be able to continue, with the key level of $93,500 being the one to break and hold above.
$93,500 is a hugely important level
Source: TradingView
The daily chart gives a better view of the breakout so far, and also gives more perspective on the horizontal resistance at $93,500. If one looks left along this line, it can be seen that this is in fact an important price structure shelf. Going further left beyond the confines of this chart also supports this.
For the $BTC price to break through this level would be huge. The next big structural level after this is at $101,000, and the price would be likely to get there fairly quickly once $93,500 can be broken and held above.
Notwithstanding, there are some bearish indications in the chart that need to be dealt with. Firstly, the Stochastic RSI indicators on all the short term time frames are at or near their top limits. These will need to reset, at least somewhat, before the price can truly start to motor higher.
Secondly, the $BTC price is still in a bear flag. The upper limits of this flag could correspond with a potential price of around $100,000, which would match the horizontal resistance, making this a difficult barrier for the bulls to break.
Lastly, the 200-day simple moving average is angled downward, which has only happened once in this entire bull cycle, and never at this much of an incline. It must be said that the price has now regained the 50-day SMA, which is perhaps starting to curl back round to the upside.
A textbook breakout
Source: TradingView
When looking at the $BTC price in the weekly time frame it is perhaps best not to overcomplicate matters. What can be seen is a textbook breakout of a falling wedge - a pattern that would normally result in a break to the upside rather than the downside.
While the price is admittedly in a bear flag, if there is going to be a strong rally back to the highs, there is only one direction to go, and that’s up and through the top of said bear flag.
Much overthinking of what might possibly happen is going to be going on in the heads of most traders and investors. That said, investing is about looking at the balance of probabilities, and then going with what seems most likely. Good risk management will help if the market starts to reverse again.
Finally, arguably one of the most reliable indicators is the Stochastic RSI - especially in the higher time frames. It’s rather like the tide going in and out. Looking left at the last time the Stochastic RSI indicators moved up from the bottom in this weekly time frame, it can be observed that a strong rally ensued. Once the indicator lines both cross the 20.00 level, this is the point where upside price momentum really kicks in. This looks as though it is soon to take place.
Disclaimer: This article is provided for informational purposes only. It is not offered or intended to be used as legal, tax, investment, financial, or other advice.


You May Also Like

Sports is business: The financial undercurrents that aspiring sports journalists should understand
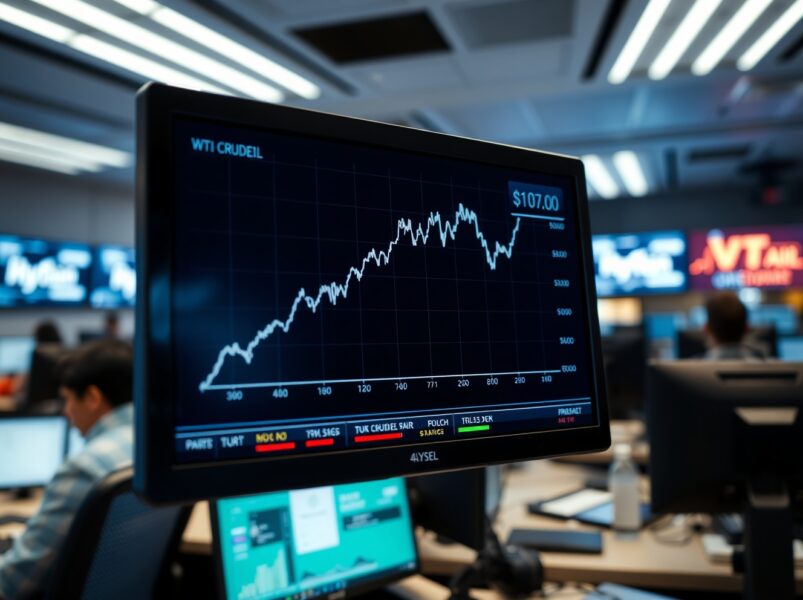
WTI Crude Oil Soars: Price Nears $105 Amid Critical Iran Infrastructure Threats