

VeChain Blockchain Gains Traction as VET Hits Kraken
- VET is currently live on Kraken, which increases access to the world and increases liquidity.
- The Kraken listing enhances market accessibility of VET, where trading is already possible.
VeChain’s native token VET has gone live for trading on Kraken, expanding access to one of the market’s longest-running enterprise blockchain networks. The listing places VET on a major U.S.-based exchange at a time when the token is showing signs of renewed trading activity.
In a blog post, Kraken confirmed that VET funding and trading came into effect on January 2, 2026. Users can deposit the token via supported networks, and trading is enabled on the platform’s standard interface. Access through the Kraken App and Instant Buy features is subject to liquidity and regional eligibility. Even so, the addition reinforces VET’s exposure to the global market participants and institutional-grade infrastructure.
Kraken Listing Expands Access to VeChain’s Enterprise Network
The Kraken listing is another step in VeChain’s effort to reach a broader market. VET is used to make transactions and transact business in the VeChainThor network as a value transfer, staking, and in governance and applications. The Kraken listing will allow traders and ecosystem users to access and use the token more easily.
It is worth noting that VeChain has continued to invest in its technical stack. As we previously reported, the recent launch of VeChain Kit v2 introduced a redesigned software development kit specifically designed for frontend dApp builders. The update features a revamped user interface, token swapping integration, and expanded wallet support, including WalletConnect and VeWorld.
These improvements lower friction for developers building consumer-facing applications on VeChainThor. In addition, customizable interface components allow teams to tailor user experiences without rebuilding core functionality.
VET Price Gains
Market data indicates that VET has made modest gains after the Kraken listing and broader updates to the ecosystem. The token was trading near $0.0116, up around 4.5% daily, after rebounding from an intraday low of close to $0.01095. Price action briefly touched the area just below $0.0120 before consolidating. The trading volume rose to more than 40%, indicating a higher level of involvement compared to liquidity action.
According to technical indicators, the RSI-14 hovered around 52, positioning the momentum on the neutral side of the positive side, allowing for further rise. Meanwhile, the MACD-12,26 indicator turned positive, the histogram moved above zero, and signal lines converged upwards. Although the shift is still moderate, it is often enough a sign of improving medium-term movement after a long decline.
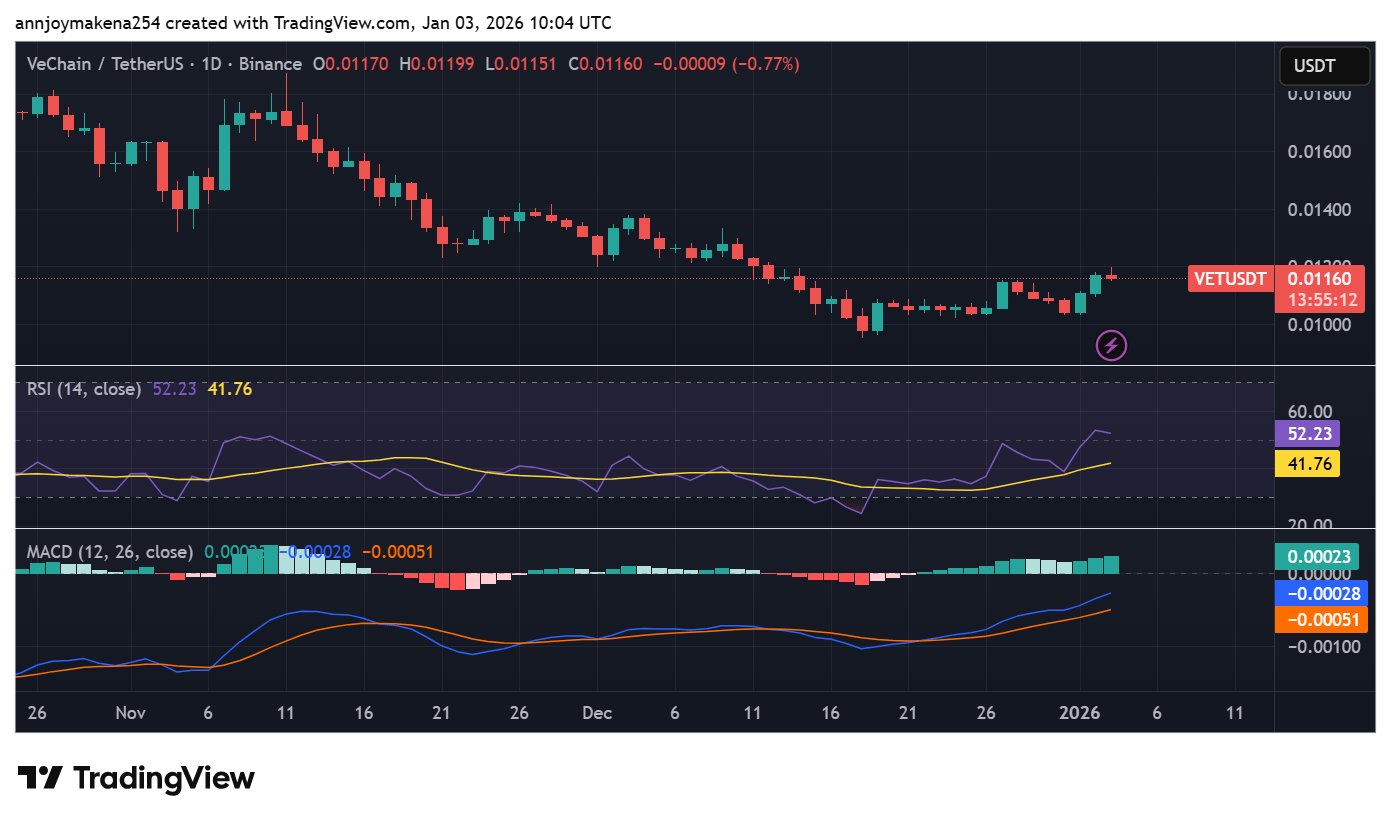 Source: Trading View
However, resistance is still in the $0.0120-0.0122 range. Sustained closes above this zone would be required to confirm a wider bullish breakout. Until that time, the charts predict prudent optimism with a positive trend momentum, but the confirmation of the longer-term trend is pending.
]]>

You May Also Like

Trump’s “ Extremely Hard” Hits Hard On Bitcoin, But Some Altcoins Make It Through
XRP Shows Growing Upside Momentum Through The Whale Vs Retail Delta – What’s Next?
XRP Price Prediction Stalls While Pepeto Locks $10M Before Listing


