Solana Price Prediction: What To Expect From SOL In January 2026
The Solana price is down about 12% over the past 30 days. As 2026 approaches, the chart shows a mix of bullish and bearish signals.
Some indicators suggest a bounce in January, but others indicate that pressure could persist if momentum fails to materialize.
History Leans Bullish, But ETF Flows And Expert Views Split
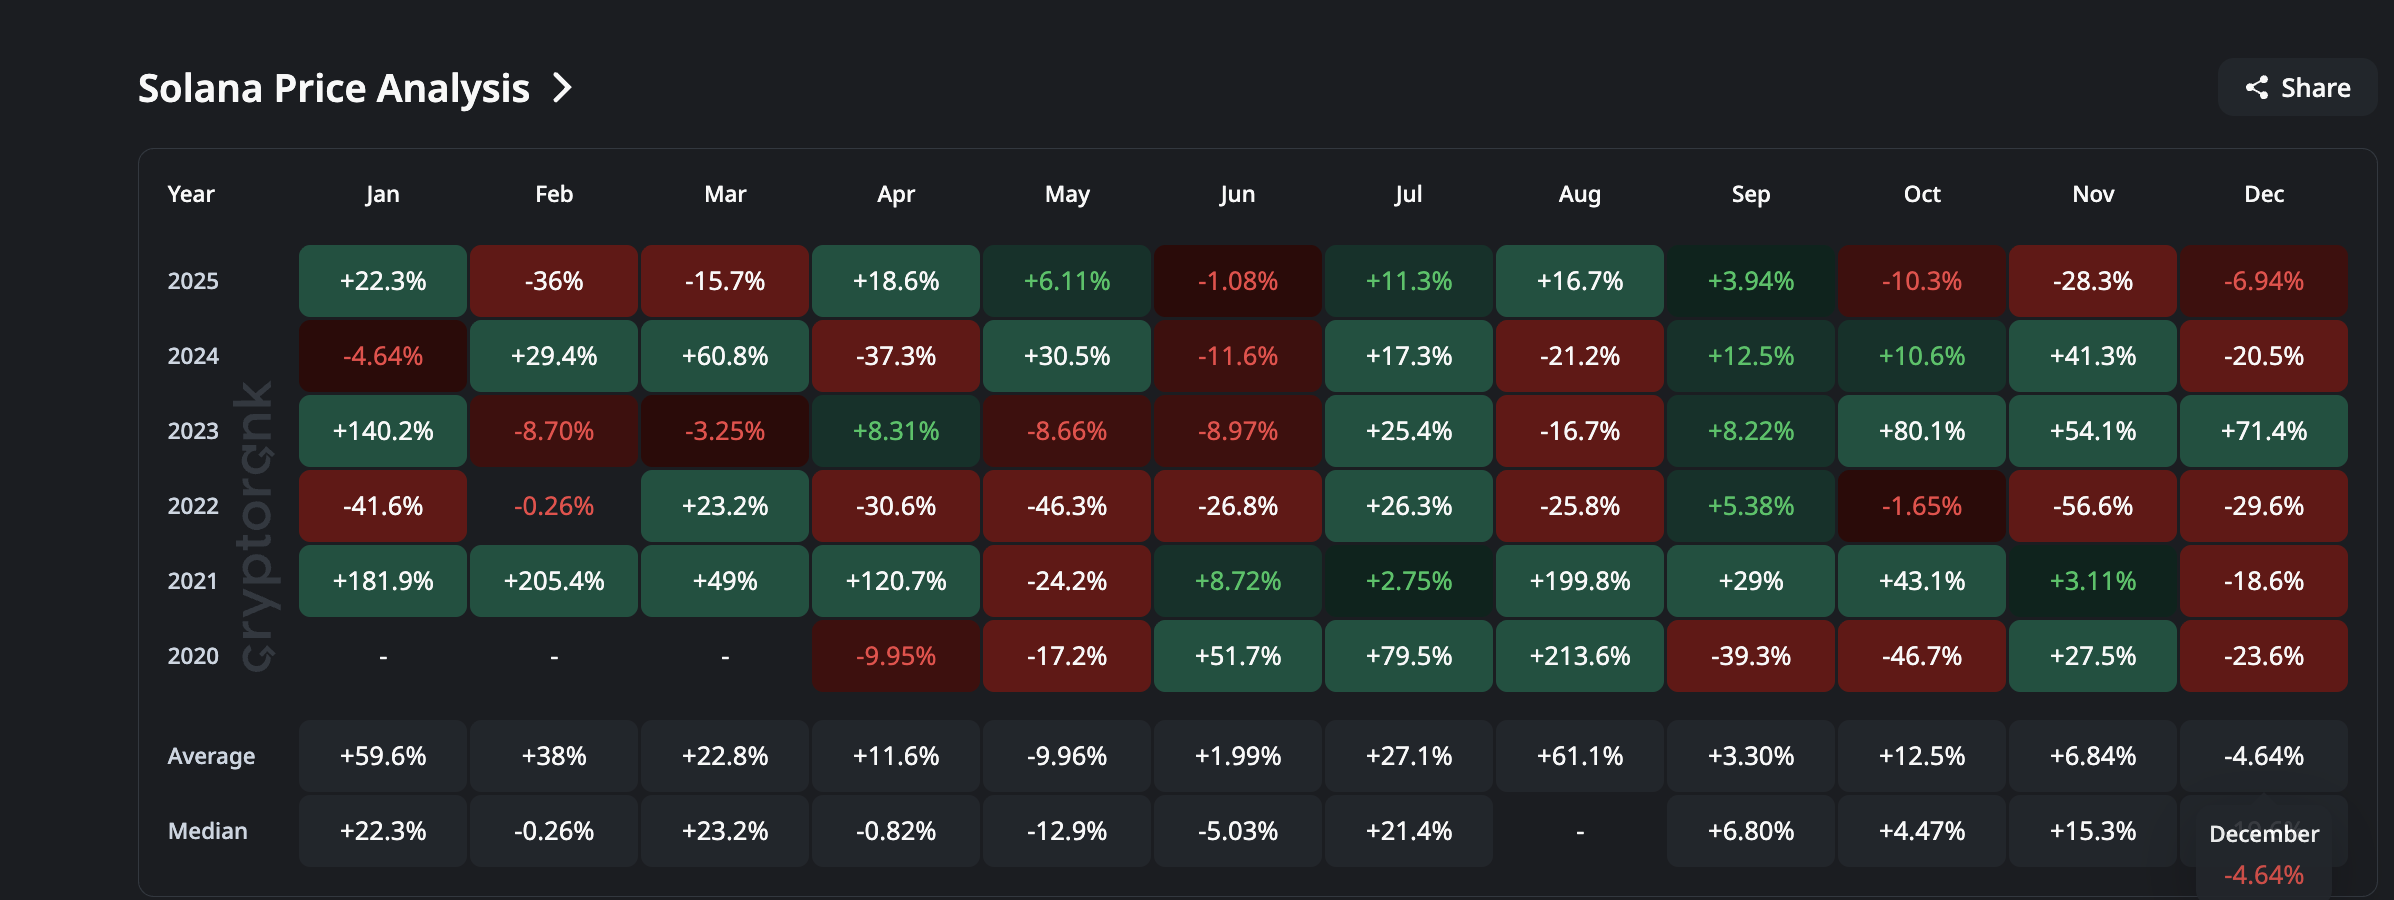
January has been a strong month for Solana. The average return sits near 59%, with median gains around 22%. The pattern sharpens when December ends red.
In 2022, SOL fell 29.6% in December, and in January 2023, SOL rallied 140%. In December 2024, SOL dropped 20.5%, and in January 2025, it rose 22.3%. This month is down 6.94% so far, which statistically leans toward a rebound.
 Red December- Green January Narrative: CryptoRank
Want more token insights like this? Sign up for Editor Harsh Notariya’s Daily Crypto Newsletter here.
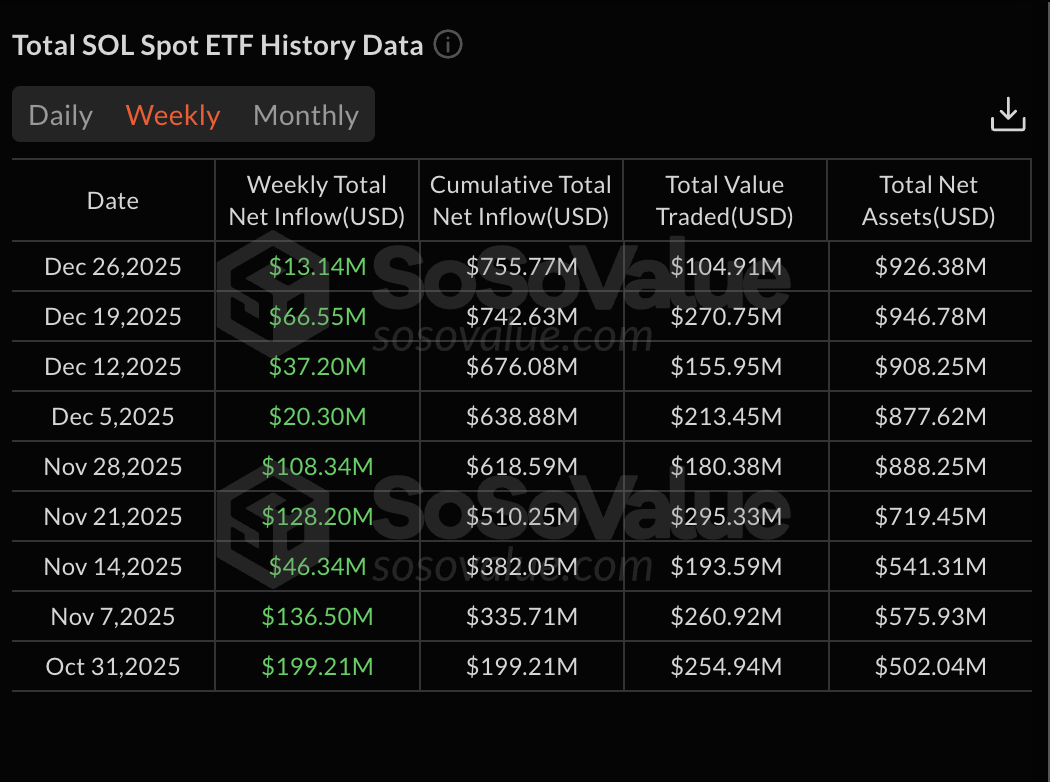
ETF data backs that idea. Since launch, Solana spot ETFs have not posted a single week of net outflows. The most recent week added $13.14 million (incomplete week still), bringing cumulative inflows to $755.77 million.
That steady demand signals selective confidence in SOL at a time when other majors face withdrawals.
 ETF Flows: SoSo Value
B2BinPay’s analytics team describes what that flow pattern means for Solana and the broader market, in their conversation with BeInCrypto:
This supports SOL’s ETF inflows, but it also warns not to frame the move as a broad altseason setup.
Chart Signals Hint At Reversal, But EMAs And Derivatives Show Resistance
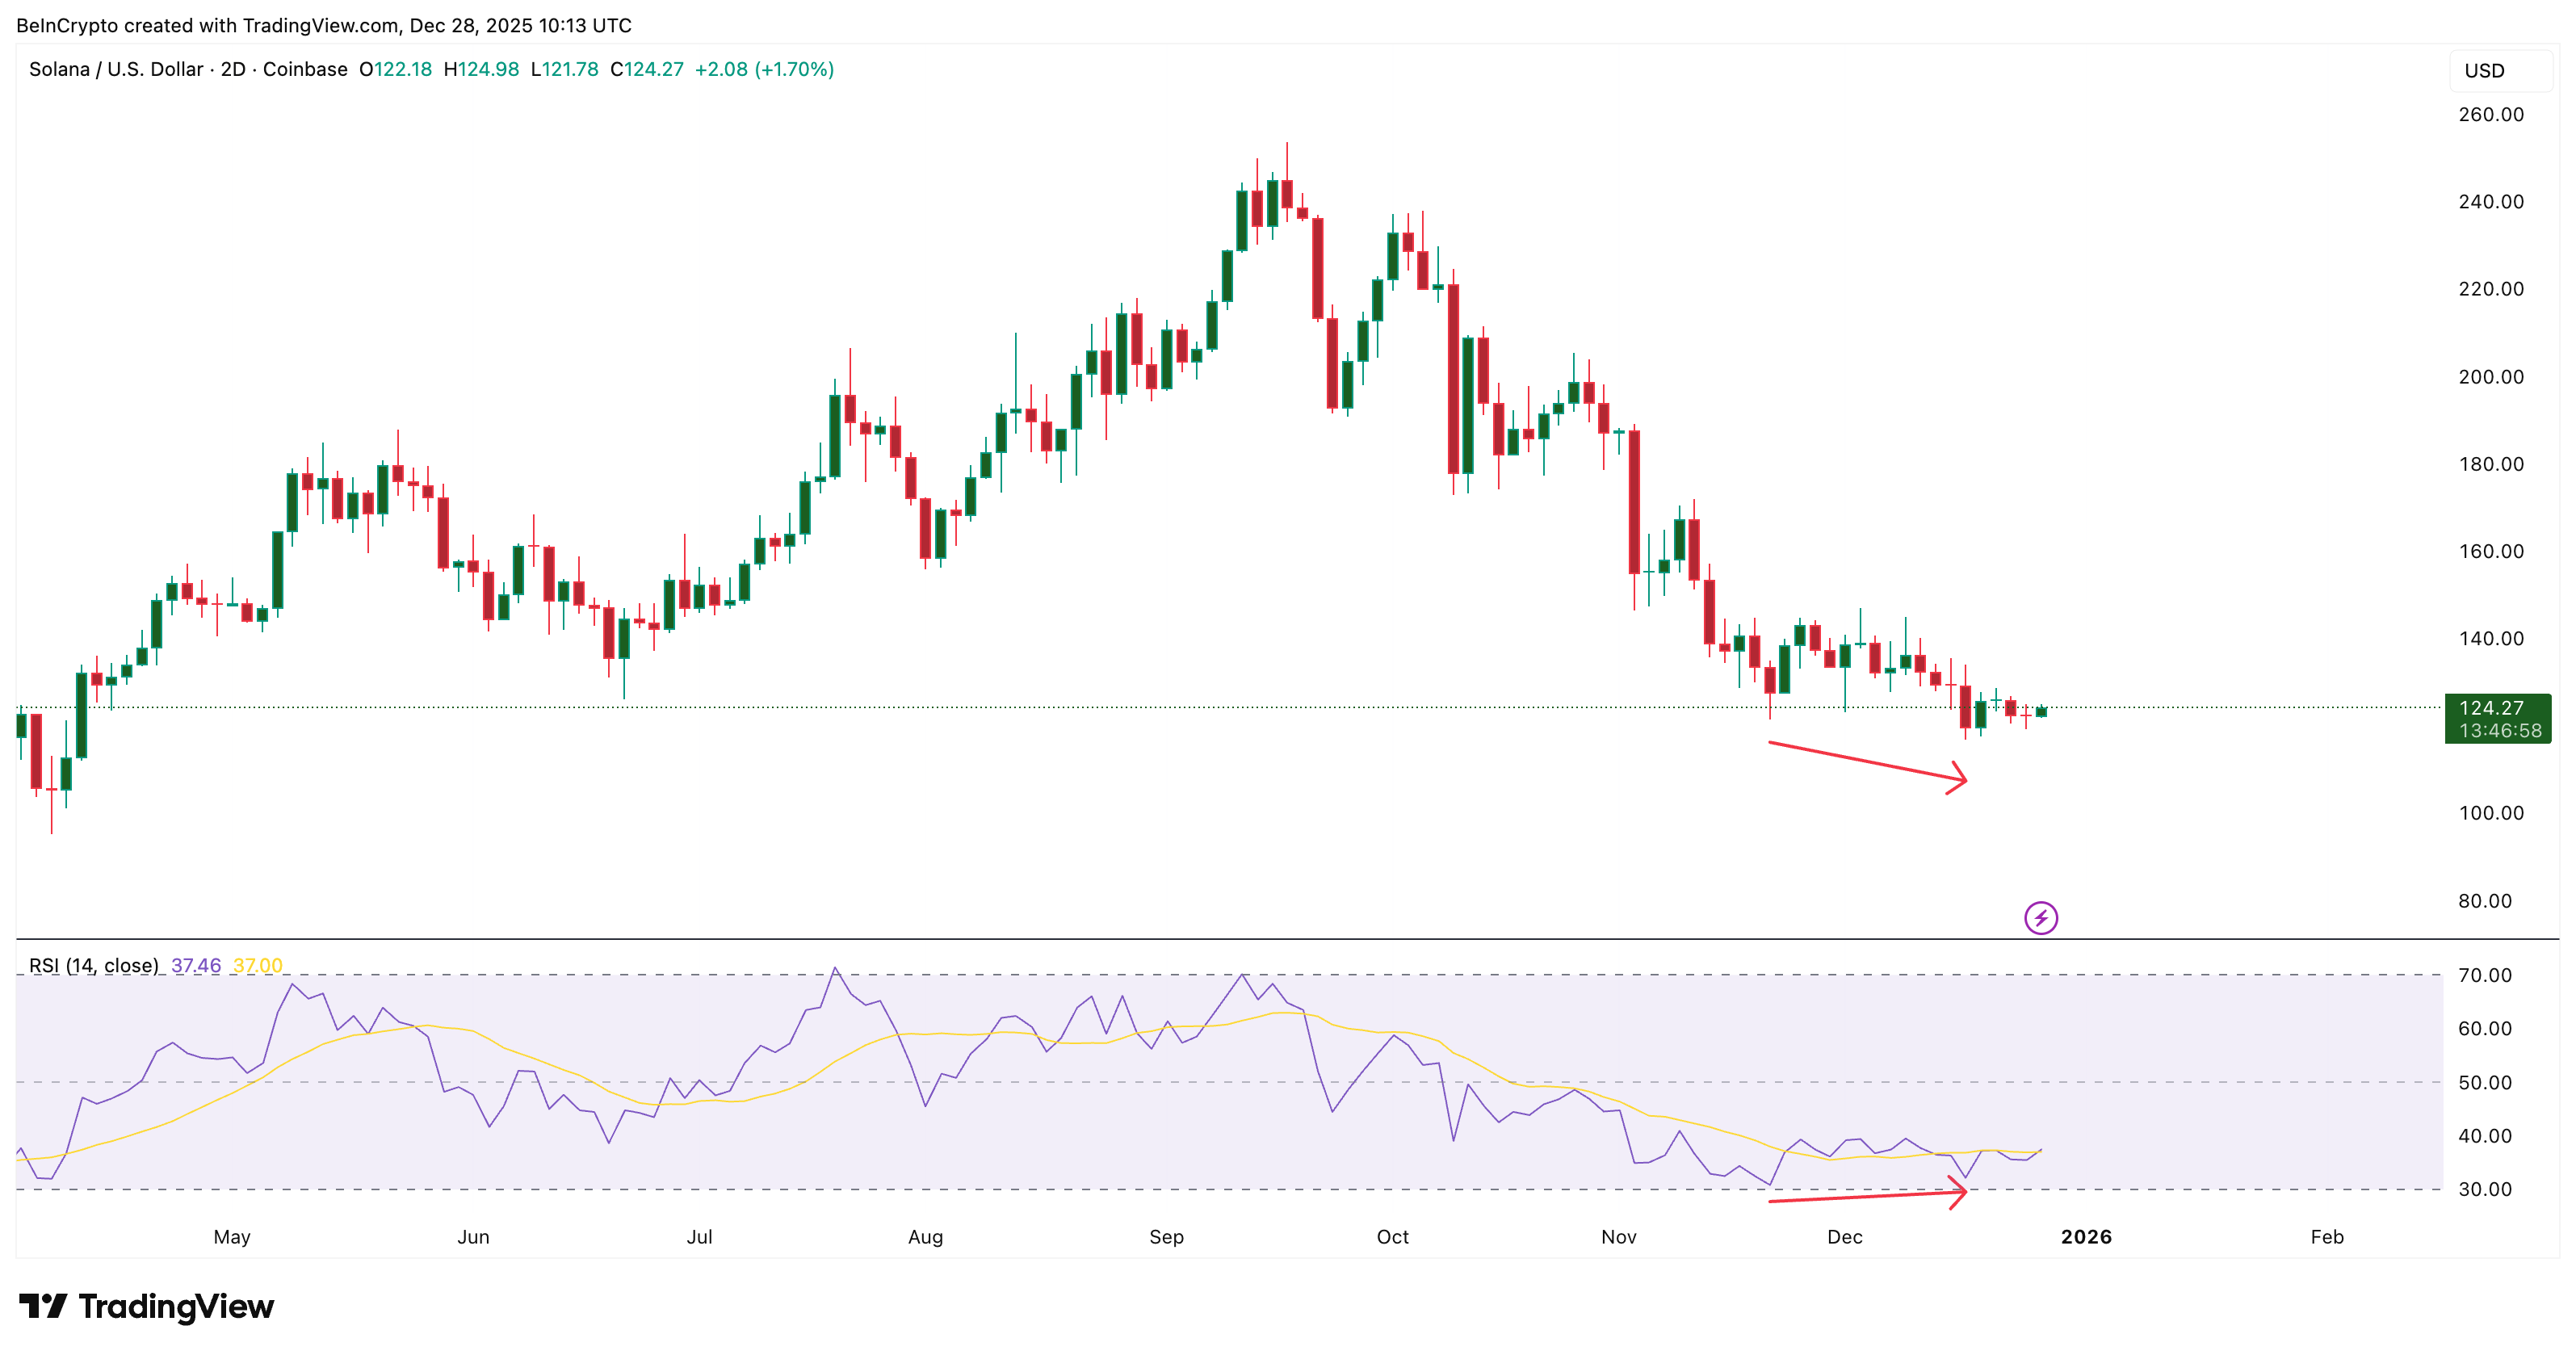
On the two-day chart, the SOL price made a lower low between November 21 and December 17, while the RSI (Relative Strength Index, a momentum gauge showing overbought/oversold strength) made a higher low. That is a bullish divergence and can indicate early trend reversal if buyers follow through.
 Bullish Divergence: TradingView
But a bearish condition sits right beside it.
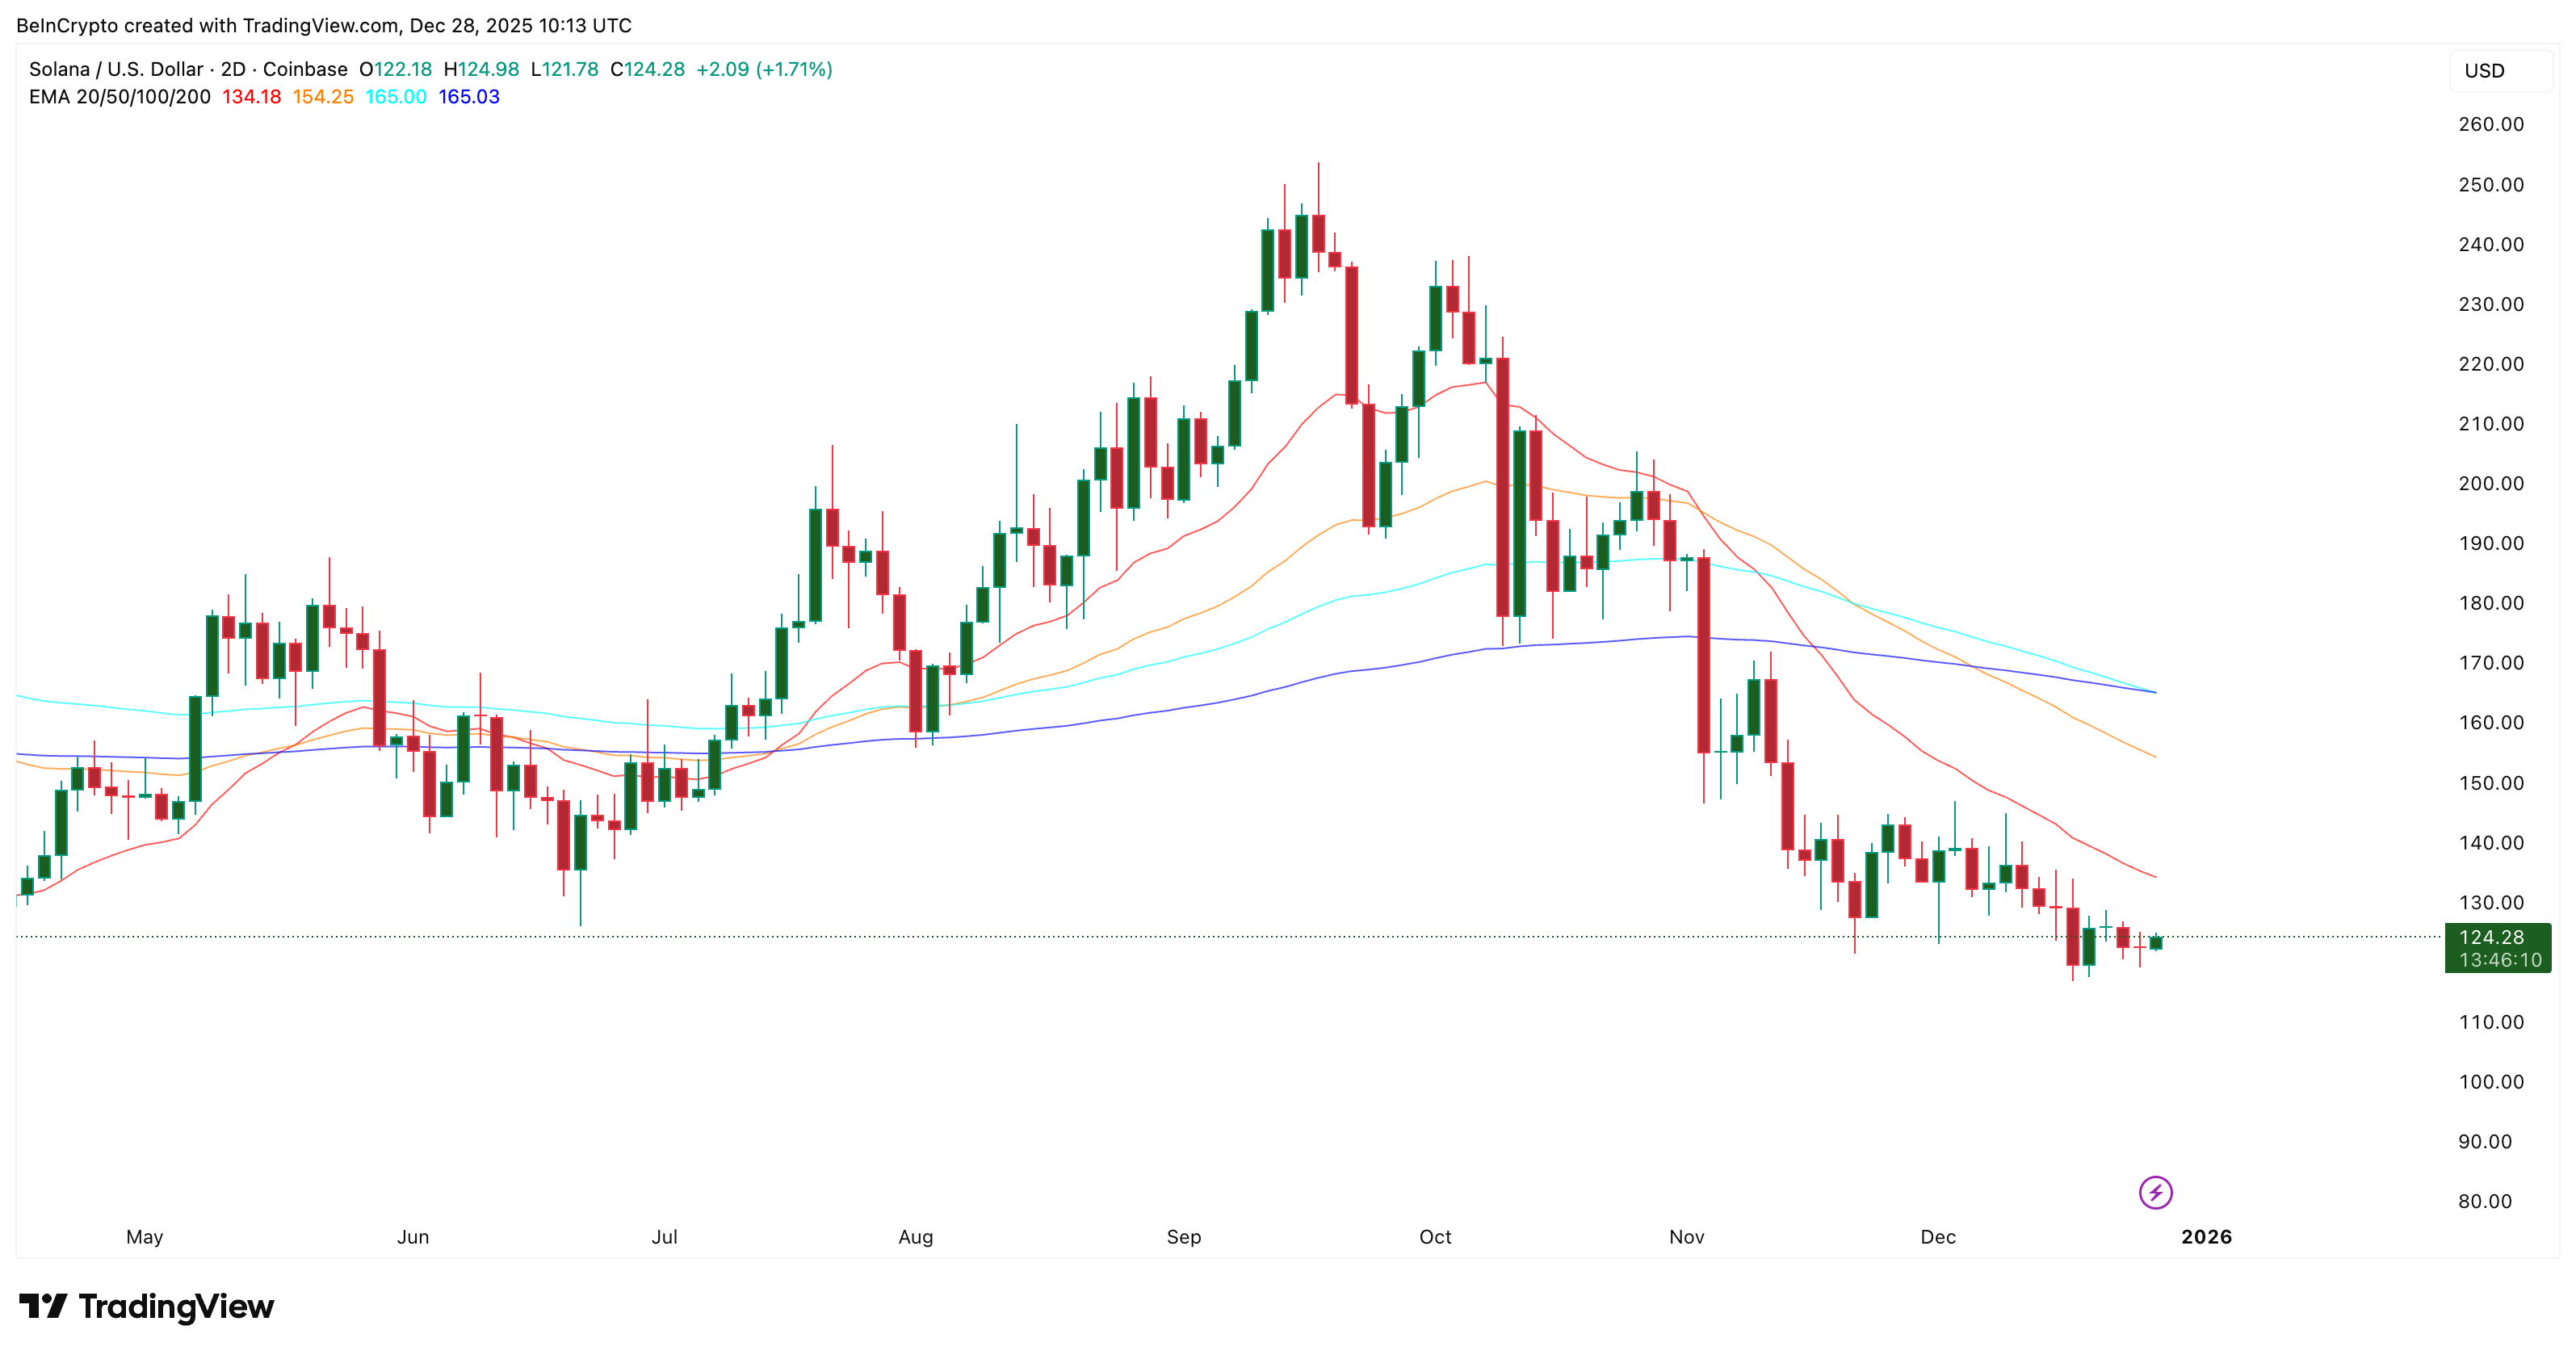
On the same timeframe, the 100-period EMA (Exponential Moving Average, a trend-tracking line that reacts faster to price) is on the verge of crossing below the 200-period EMA.
If that bearish crossover confirms, downside pressure could continue into late December or early January before any recovery can stick. Until that crossover is avoided or reversed, the technical picture stays split.
 Solana Has Bearish Indicators In Play: TradingView
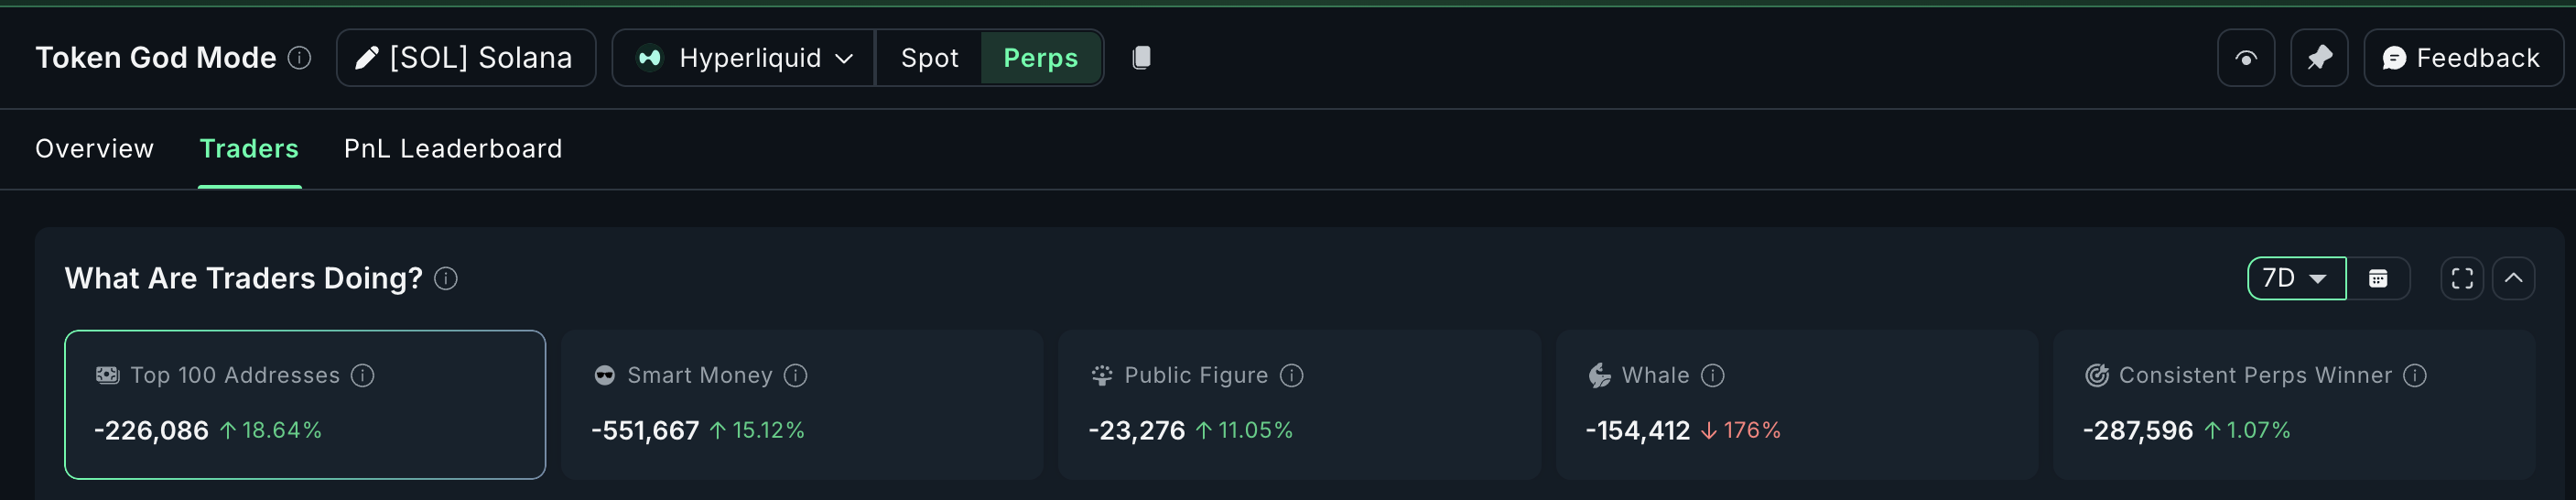
Derivatives positioning shows more caution. On Hyperliquid, almost every trader bracket has net short positioning across the last seven days.
Top 100 addresses, smart money, and Solana whale accounts are all net short. Yet, some groups (smart money, public figures, and perp winners) are slowly opening longs. That could be in anticipation of a bullish January 2026, as highlighted earlier.
 SOL Derivatives: Nansen
This mix leaves the setup balanced. Momentum suggests a reversal could be forming. EMAs and derivatives positioning argue for patience. If Solana wants to build a January rally, it needs to flip that derivative sentiment away from shorts while avoiding the EMA cross.
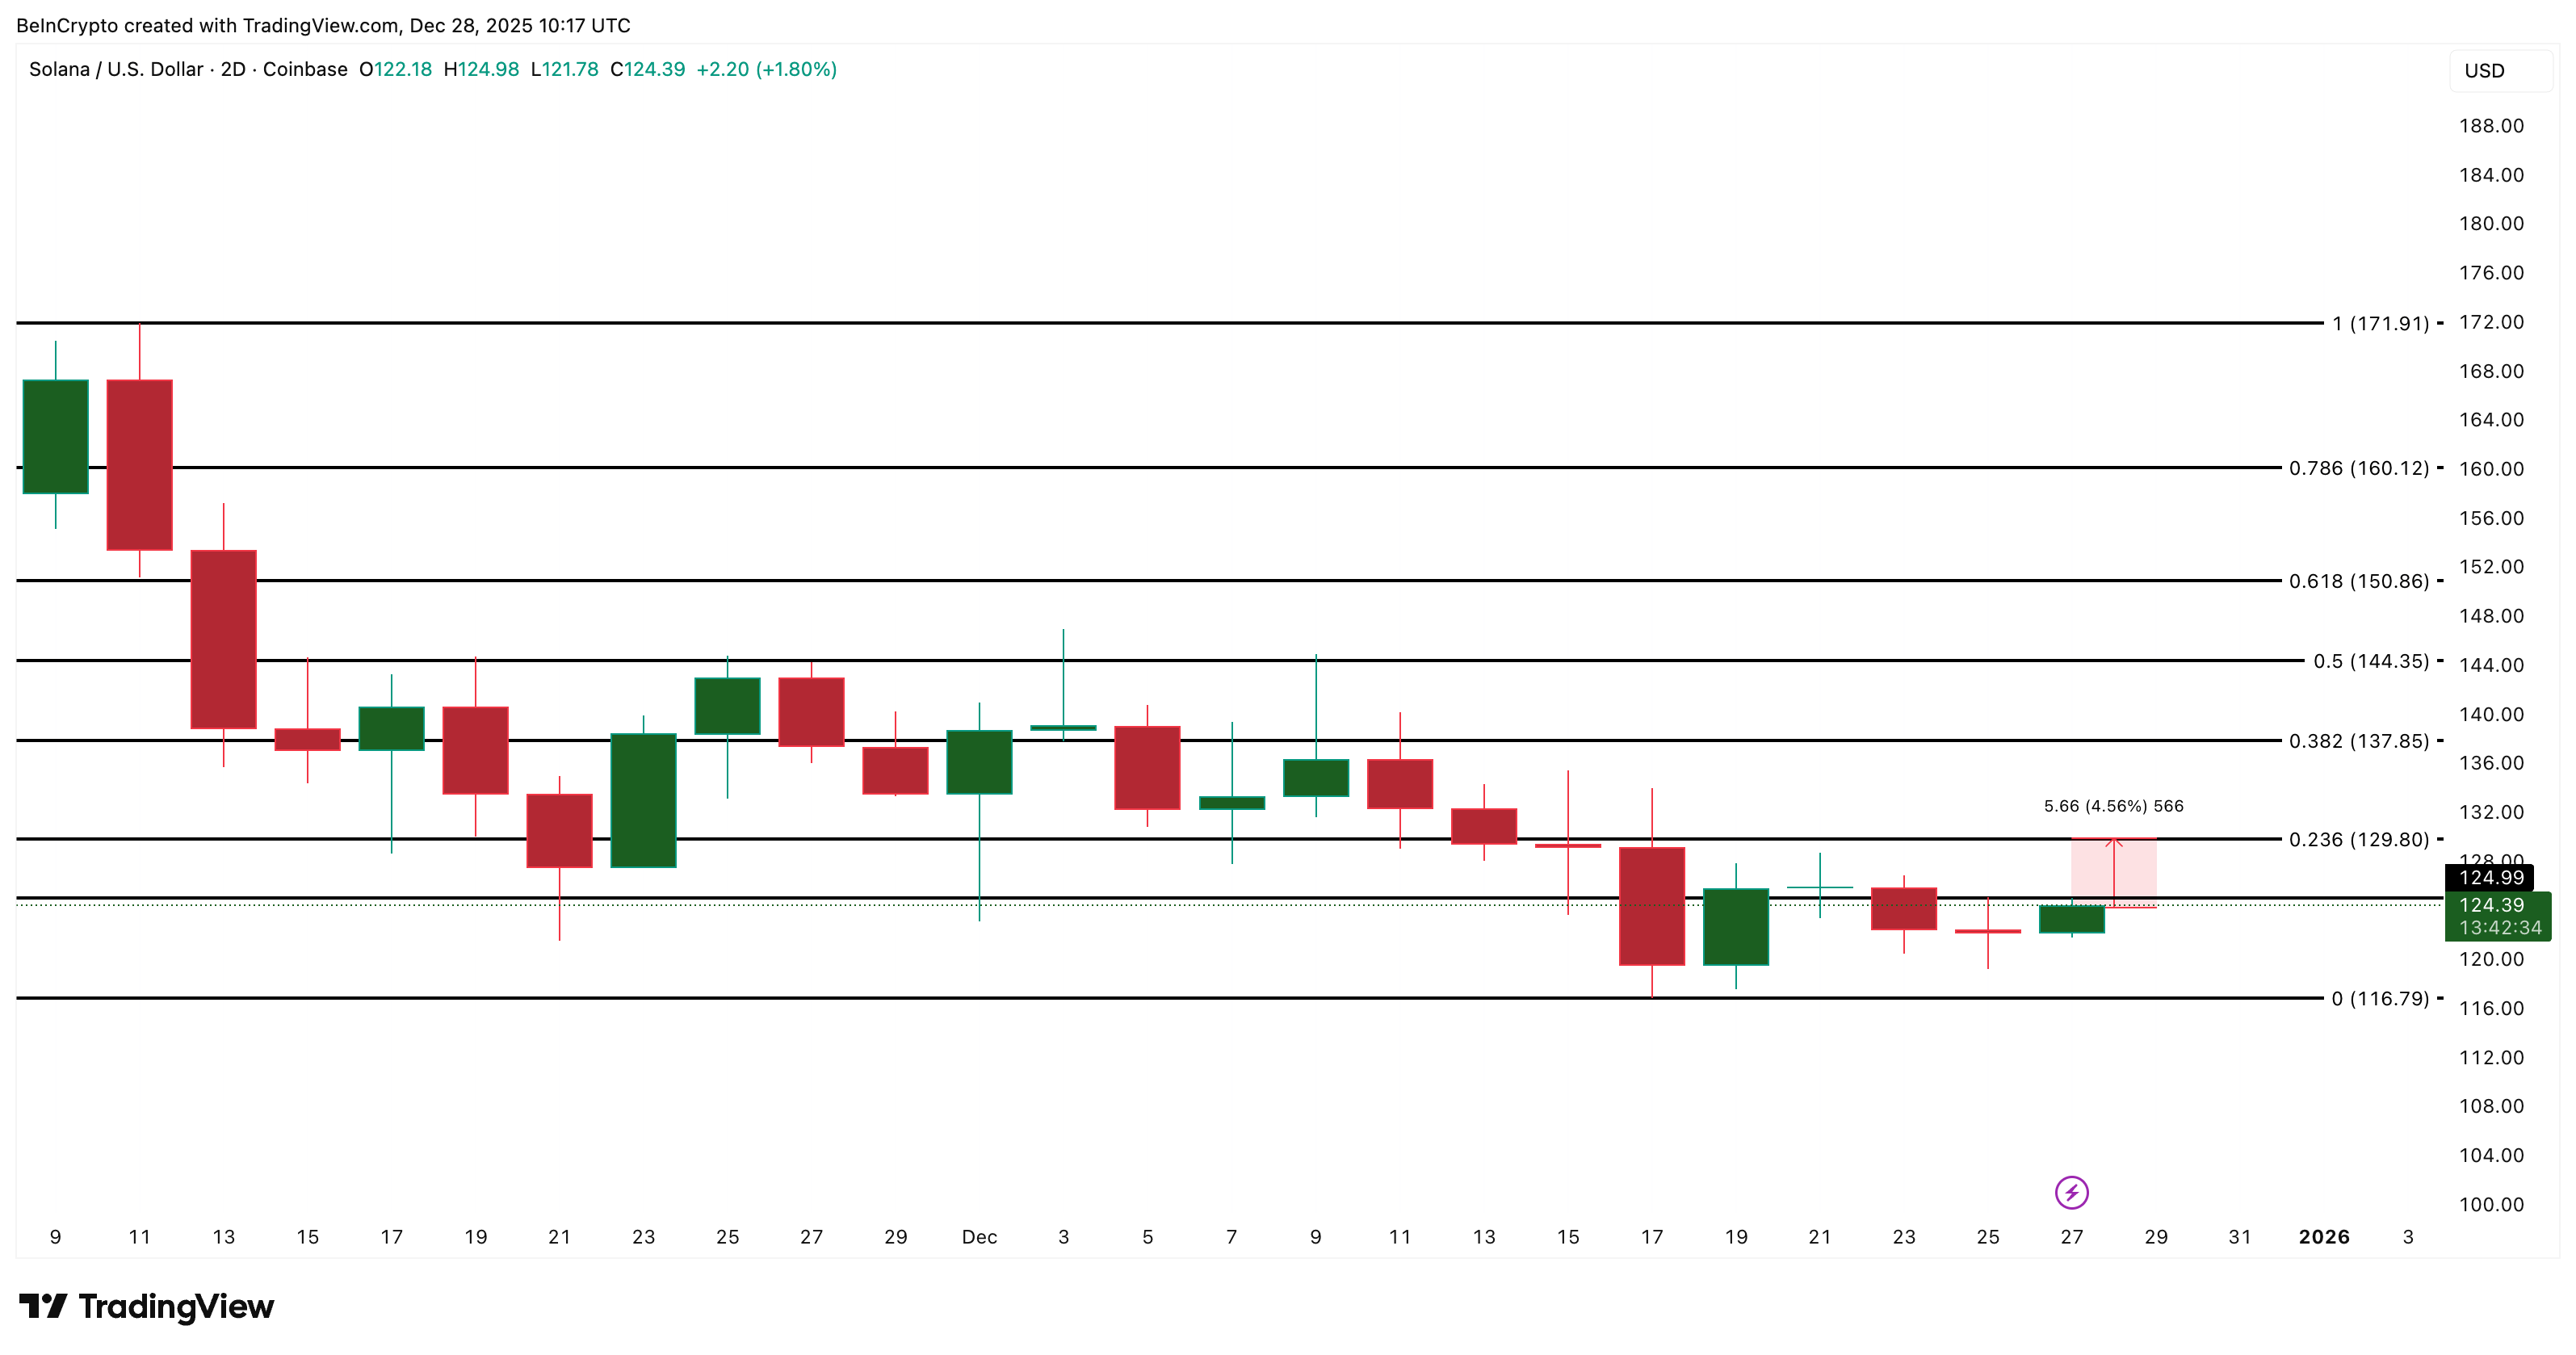
Key Solana Price Levels: $129 Is The Pivot, $116 Is The Fail-Safe
SOL trades near $124. A two-day close above $129 would confirm strength and open a path toward $150. Clearing $150 could then target $171 if ETF inflows hold and RSI momentum continues to build.
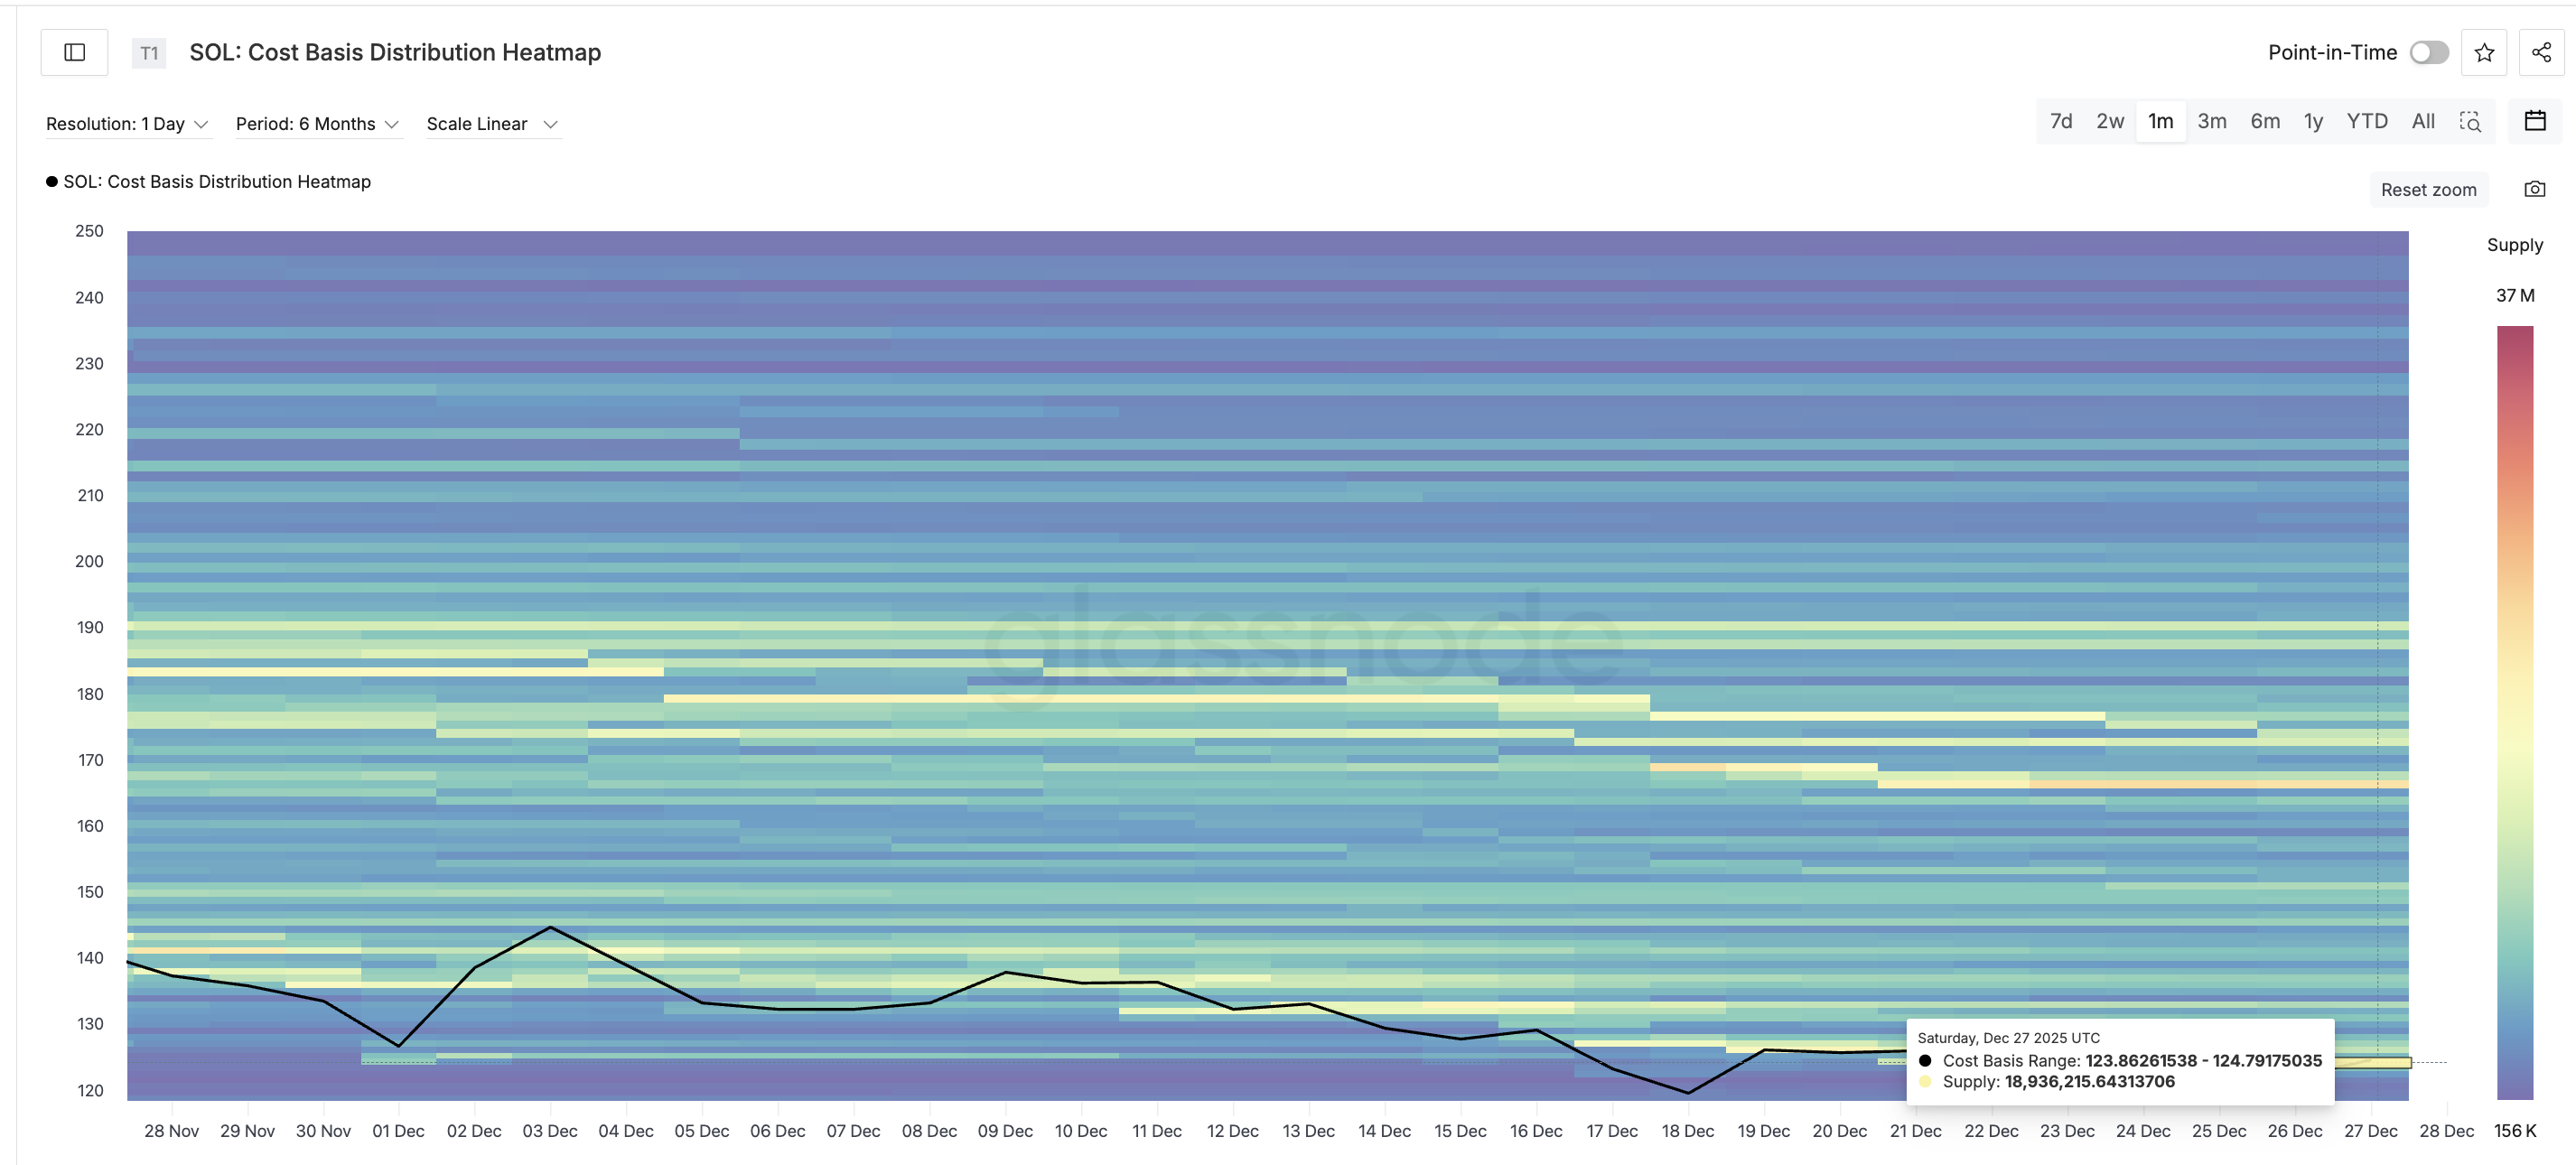
Cost-basis heat map data explains why $129 matters. One of the strongest supply clusters sits between $123 and $124, and SOL is currently fighting through it.
A close above $129 clears that cluster and removes immediate overhead resistance. Above that, supply thins until $165 to $167, improving the odds of continuation if volume arrives.
A cost-basis heat map tracks where large groups of holders acquired their tokens, which highlights zones where supply or demand may cluster.
 Solana Heatmap: Glassnode
On the downside, $116 stays the fail-safe. Losing that level breaks the historical “red December, green January” trend and sets up continuation of the downtrend. A confirmed bearish EMA crossover, accompanied by a break below $116, would reset expectations for the month.
 Solana Price Analysis: TradingView
For now, the trade is defined by two thresholds. Above $129, bullish momentum allows room to move toward $150 and $171. Below $116, buyers lose control, and January’s usual strength may not show up.


You May Also Like

Gold Price Forecast: Stable at $4,700 as markets await news from Trump-Xi meeting

INSTITUTIONAL | BitGo Q1 2026 Losses More Than Double Despite Over 40% Growth in Client Base