

Best Meme Coins to Buy: SPX6900 Price Prediction, Next 1000x Crypto

SPX6900 (SPX) is back in the spotlight after a wild week of price action. Although the coin is still down around 3% for the week, it has climbed over 8% in the past month. This sudden strength raises a big question: What is driving the pump, and is it time to load a bag?
The broader crypto market is also helping SPX recover. Even though the day shows red numbers, overall sentiment has steadily improved. The Fear and Greed Index now sits at 20 after bouncing from extreme fear, and the total crypto market cap remains above $3 trillion.
With Bitcoin holding above $90,000 and Ethereum fighting to stay above $3,000, the market continues to trade in a stable range.
This kind of range-bound environment is important because it creates the perfect conditions for meme coins like SPX to move quickly once momentum starts to build.
As traders search for the best meme coins to buy, the market is increasingly dividing into two camps: pure community-driven tokens like SPX, and high-utility meme coins that offer foundational value.
While SPX capitalizes on immediate viral momentum, projects like Bitcoin Hyper (HYPER) are emerging as a strategic alternative, often ranked alongside the next 1000x crypto due to their massive upside potential.
SPX6900 (SPX) Price Prediction
SPX6900 (SPX) continues to trend strongly after a powerful weekend rally, drawing new attention and heavy buying volume throughout early December. It now ranks as the top gainer among the top 500 cryptocurrencies, climbing more than 8% on the month.
Even though the token trades about 1% lower on the day, it still sits near $0.71 and remains 4% down on the week, which many new traders view as a fair entry zone while the price stays under $1.
SPX6900 holds a market cap of roughly $660 million with about 930 million coins in supply, giving the project plenty of room for rapid upside if demand increases. Analysts point to the $0.40 zone as a major support level.
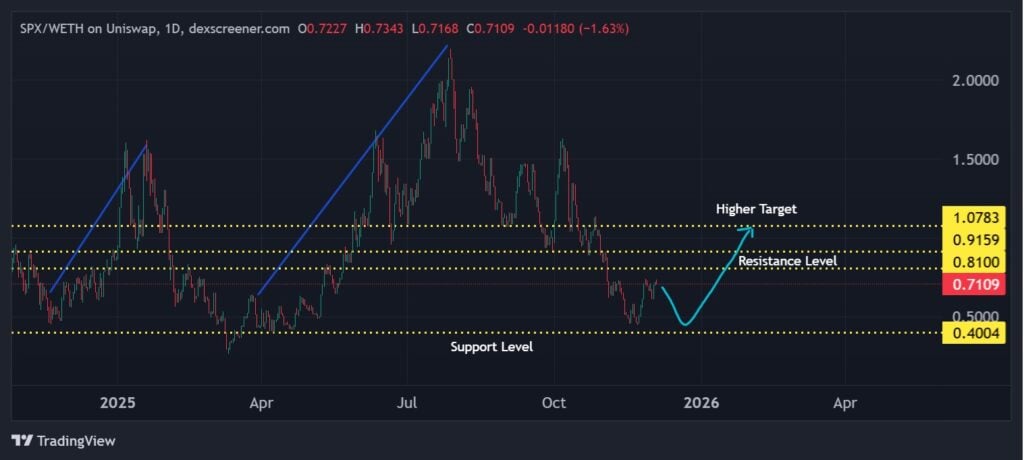
This area held firm multiple times throughout the project’s history and created a powerful bounce during its most recent test. Since assets with strong historical bases often outperform during market recoveries, traders continue to watch the $0.40 level closely during any dip.
SPX also created a new resistance zone that now acts as a ceiling. Price needs to break above this level to confirm fresh bullish momentum. Until buyers push through, sellers keep control and upside stays capped.
If SPX breaks that resistance, the chart points toward higher targets at $0.81 and $0.91, where previous support flipped into resistance. The projected move shows a bullish stair-step pattern with higher lows building into higher highs.
The community keeps buying aggressively, pushing SPX into the spotlight as one of the best meme coins to buy now. Influencers and analysts argue that SPX still has major upside from its $650 million valuation, comparing its potential to other viral meme coins.
Adding even more energy to the bullish narrative, crypto analyst Murad told his followers that helping SPX6900 reach “1,000,000+ believers” could be one of the greatest contributions someone makes to the world, strengthening confidence across the community.
SPX6900 Price Surge Aligns With Bitcoin Hyper’s Rise as the Next 1000x Crypto
Bitcoin Hyper (HYPER) has a clear goal: turn idle BTC into something people can actually use. Instead of leaving coins parked on exchanges or in cold storage, holders can move wrapped BTC onto a Bitcoin-secured Layer 2 that gives low fees, high speed and fast confirmations for real apps.
By using the Solana Virtual Machine, Bitcoin Hyper aims for performance that can match or even beat Solana while it still settles back to Bitcoin. The project does not only focus on DeFi traders.
Developers also get an SVM-based setup with Rust tools, SDKs and APIs built for NFTs, gaming dApps and payment systems. This mix of speed and programmability, backed by the Bitcoin brand, explains why the presale is doing so well right now.
The team also set up smart tokenomics. They fixed $HYPER’s supply at 21 billion as a nod to Bitcoin and offer 40% APY staking rewards to encourage people to hold through launch.
While many retail traders worried about Monday’s drop, on-chain data shows some whale wallets bought more $HYPER. That behavior signals that big players see value here even with a choppy market.
The Bitcoin Hyper presale has already reached about $28.9 million, with the token now priced at $0.013375.
Based on this growth and how the market responds to Bitcoin Hyper’s idea, many analysts expect $HYPER to rank among the best meme coins of 2025 and even call it a potential next 1000x crypto.
Anyone who wants to buy $HYPER before the next price increase can go to the official Bitcoin Hyper website and connect a wallet. Buyers can swap USDT, BNB, ETH for $HYPER or simply use a bank card.
Visit Bitcoin Hyper
This article has been provided by one of our commercial partners and does not reflect Cryptonomist’s opinion. Please be aware our commercial partners may use affiliate programs to generate revenues through the links on this article.
You May Also Like

Fan Token Firm Chiliz Acquires 2-Time ‘Dota 2’ Champions, OG Esports

How to earn from cloud mining: IeByte’s upgraded auto-cloud mining platform unlocks genuine passive earnings


