

SUI crypto: is the neutral trend hiding a bullish breakout?

 SUI crypto is trading in a delicate balance, caught between an improving short-term impulse and a still-muted broader trend. In this piece we look at how daily and intraday indicators line up, what they say about market sentiment, and which price zones could decide whether the next significant move is higher or lower.
 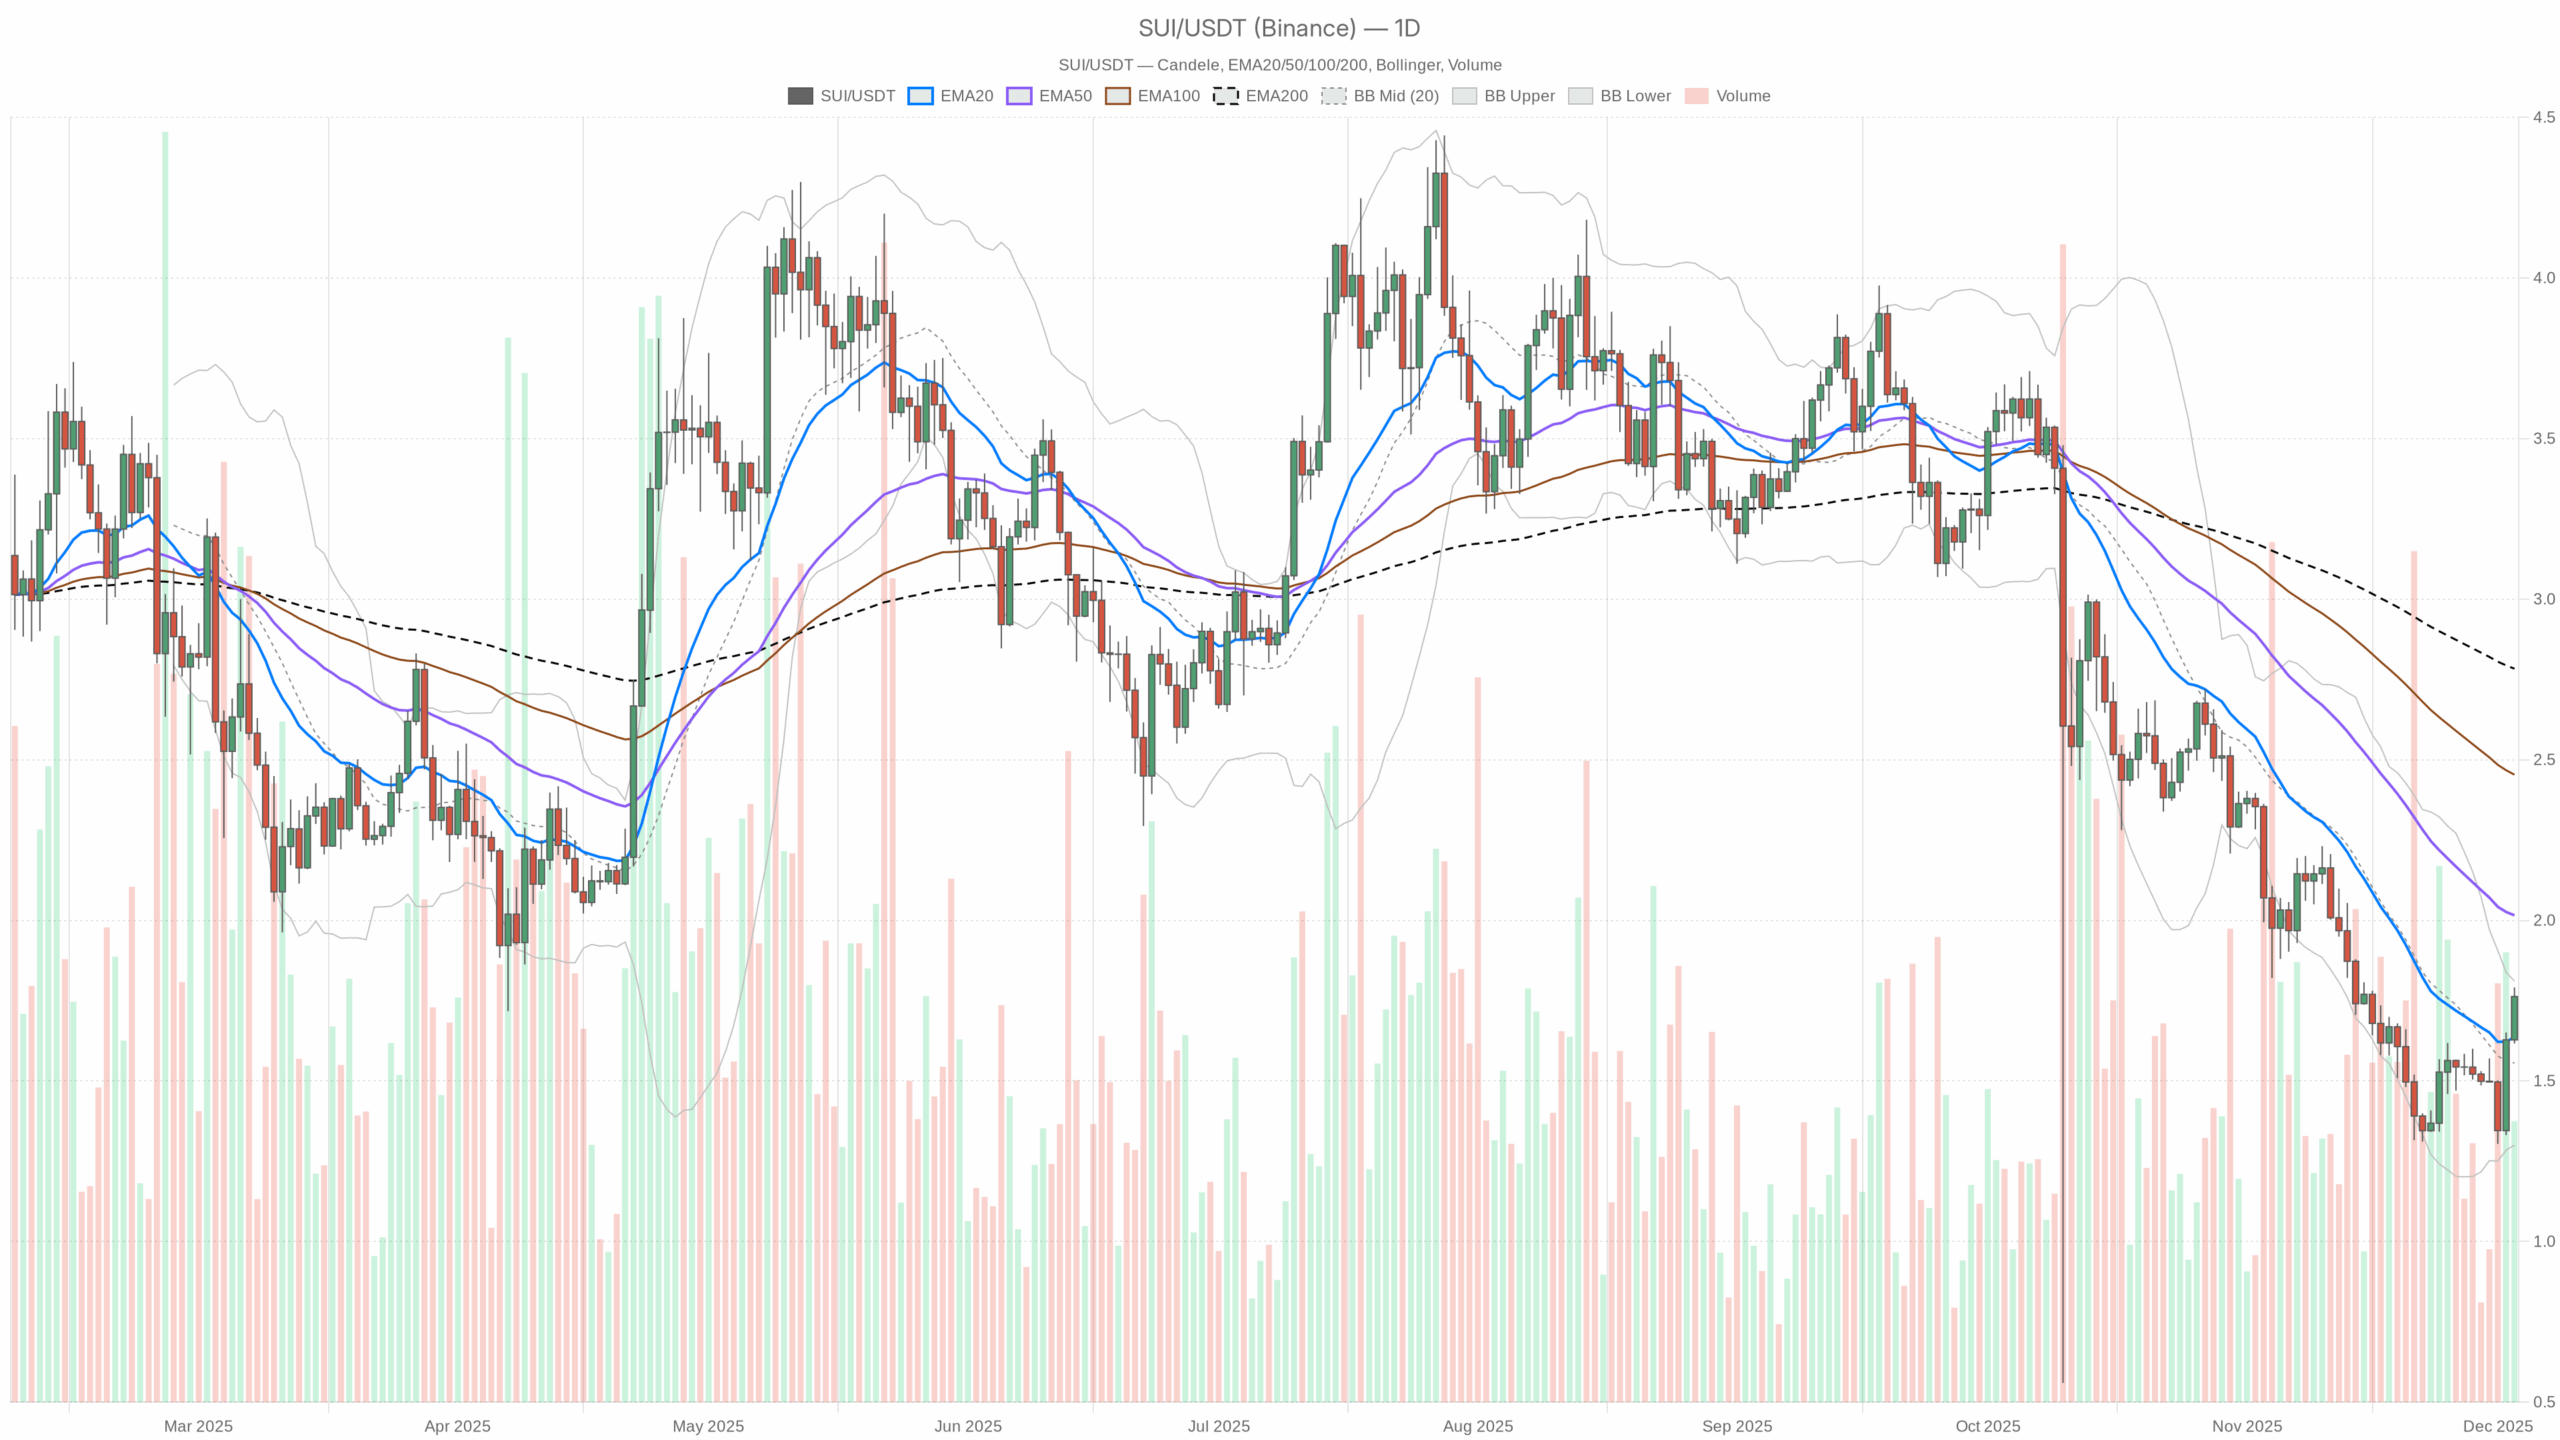 SUI/USDT — daily chart with candlesticks, EMA20/EMA50 and volume.
Summary
The asset changes hands around 1.76, slightly above its daily pivot at 1.72, showing cautious buying interest after recent volatility. On the daily chart, price trades above the 20-day EMA but well below the 50- and 200-day EMAs, confirming a neutral market regime with no decisive longer-term trend. Momentum gauges such as RSI near 52 and a marginally positive MACD histogram hint at early bullish momentum rather than a fully formed uptrend. Moreover, Bollinger Bands show price leaning toward the upper band, signaling mild upside pressure within a still-contained volatility environment. Hourly and 15-minute timeframes, however, are clearly positive, with strong EMAs alignment and overbought intraday RSI. Overall, traders are shifting from fear to selective risk-taking, but confirmation levels above current prices remain crucial.
SUI crypto: Market Context and Direction
The broader crypto market backdrop is supportive, with total capitalization around 3.23 trillion dollars and a solid 24-hour advance of nearly 7%. However, Bitcoin dominance near 57% suggests that capital is still concentrated in large caps, leaving altcoins in a more selective environment. In this context, the token is trying to rebuild confidence while the overall sentiment, as captured by the Fear & Greed Index at 28, remains in the Fear zone. That said, a fearful backdrop combined with a constructive chart often creates conditions for contrarian opportunities, provided technical confirmation appears. Moreover, the on-chain and DeFi ecosystem around Sui shows activity through venues like Cetus CLMM and Bluefin Spot, indicating that traders continue to use the chain for liquidity and fee generation even as price consolidates.
Technical Outlook: reading the overall setup
On the daily timeframe, the asset closes at 1.76, above the 20-day EMA at 1.64 but below the 50-day EMA at 2.02 and the 200-day EMA at 2.78. This structure indicates a market that has staged a short-term recovery within a broader down- or sideways phase. As a result, the first step toward a more convincing uptrend would be a sustained move toward the 50-day average, where many medium-term traders watch for trend confirmation.
The daily RSI at 51.91 sits almost exactly at equilibrium, slightly favoring the buyers. This level indicates that recent gains have brought the token out of oversold territory, but not into aggressive overbought conditions. In practice, the market is in a zone where momentum can expand without immediate exhaustion, provided follow-through buying emerges.
The MACD picture corroborates this reading. The indicator shows a negative line and signal (-0.14 and -0.19), but with a positive histogram of 0.05. This means the bearish momentum that dominated previously is fading and may be in the early phase of a bullish crossover setup. However, until the MACD line clearly overtakes its signal, the larger trend remains cautious, and rallies can still fail at overhead resistance.
Bollinger Bands on the daily chart, with a midline at 1.56 and an upper band around 1.81, frame the current price just under the upper envelope. This positioning signals that buyers are testing the limits of the recent range without yet triggering a full volatility expansion. Meanwhile, the ATR at 0.14 confirms that daily moves are meaningful but not extreme, fitting well with a phase of controlled recovery rather than panic or euphoria.
Intraday Perspective and SUIUSDT token Momentum
Intraday dynamics are far more energetic. On the hourly chart, the price at 1.76 sits comfortably above the 20-, 50-, and 200-period EMAs (1.64, 1.54, and 1.5 respectively). This alignment reflects a strong bullish intraday trend, as shorter averages stack above longer ones and all of them support price. As a result, pullbacks into this EMA cluster may attract dip buyers, at least in the short term.
The hourly RSI near 84 is clearly overbought, pointing to an overheated move that could invite consolidation or a minor correction. However, overbought conditions within a strong trend often translate into momentum-driven grind-ups punctuated by shallow pullbacks rather than immediate reversals. The hourly MACD is also positive, with a mildly constructive histogram, reinforcing the view that bulls hold the initiative intraday.
On the 15-minute chart, RSI around 69 and a bullish EMA stack (20 at 1.74, 50 at 1.68, 200 at 1.53) confirm a similar story, but with slightly less extreme momentum. Moreover, Bollinger Bands on these short timeframes are relatively tight, with price hugging the upper band near 1.78. This suggests a controlled intraday breakout attempt that still lacks a blow-off top signature.
Key Levels and Market Reactions
Daily pivot levels provide a helpful roadmap. The central pivot at 1.72 has acted as a reference point, with price now trading just above it, hinting that buyers are trying to turn this area into a short-term floor. Immediate resistance emerges around 1.81, near the upper Bollinger Band and slightly below the daily R1 at 1.83. A clear, high-volume push through this zone would open the door to a more decisive bullish continuation, validating the intraday strength seen on the hourly and 15-minute charts.
On the downside, first support lies around 1.66, in line with the S1 daily pivot. A break back below 1.72, followed by acceptance under 1.66, would signal that the recent bounce is losing traction. In that case, the market could slip back toward the Bollinger midline near 1.56, where medium-term participants might reassess risk and potential accumulation. Meanwhile, intraday traders will be watching the hourly pivot at 1.76 and nearby support at 1.75: holding above these micro levels keeps the very short-term structure intact, while repeated failures could telegraph a deeper pullback toward the daily averages.
Open your Investing.com account
This section contains a sponsored affiliate link. We may earn a commission at no additional cost to you.
Future Scenarios and Investment Outlook
Overall, the main scenario on the daily chart remains neutral with a bullish bias: short-term indicators are improving, but major moving averages still cap the upside. If price can hold above the 1.72 pivot and eventually challenge the 2.02 daily EMA50, the market would signal a genuine shift toward a more durable uptrend. In contrast, a rejection below 1.66 followed by weakness toward 1.56 would argue that the recent strength was only a corrective bounce within a broader sideways-to-down structure. For investors, this suggests a phase where staggered entries and tight risk management may be preferable to aggressive all-in exposure, while active traders can lean on the clearly defined intraday levels to navigate the next swing.
This analysis is for informational purposes only and does not constitute financial advice.
Readers should conduct their own research before making investment decisions.
You May Also Like

Why Cosmetic Boxes Matter for Beauty Brand Growth

Why The Green Bay Packers Must Take The Cleveland Browns Seriously — As Hard As That Might Be


