Measuring Non-Linear User Journeys: Rethinking Funnels Metrics in A/B Testing
Introduction
In a mature product, it is often difficult to achieve a statistically significant impact on key business metrics such as revenue per user or the number of orders. Most changes are aimed at point improvements in the funnel or individual stages of the user journey, and the impact of such changes on business metrics is usually lost in the noise. Therefore, product teams quite often choose a corresponding conversion as the target metric and design experiments in a way that achieves the required statistical power.
\ However, from time to time, we notice that funnel metrics do not move in line with the dynamics of top-level indicators. Moreover, in some tests, conversions at the stages that precede the implemented changes can change in a statistically significant way. As a result, interpreting such experiments becomes difficult, and the risk of making wrong decisions increases.
\ ==As an example, consider a service where a user creates an order, receives offers from different performers, chooses a suitable one, and waits for the task to be completed.==
\ ==Suppose we have developed a new feature that highlights the best offer and is expected to increase the share of orders where a match between the customer and the performer occurs.==
\ ==During the experiment, we may observe that:==
- ==The share of successful orders decreases.==
- ==The total number of orders and completed orders increases.==
- ==The share of orders that received at least one offer decreases.==
\ ==Such a pattern may occur if the user has the ability to return to previous stages and, for example, re-post the order.==
\ We discovered similar patterns in our own experiments. In inDrive, passengers can propose their own price, after which they receive offers from drivers and choose the most suitable one. Many users actively use the bargaining features and, trying to get a better price, may change the order conditions and create it again. This leads to a series of orders before a trip actually takes place.
\ Our passenger fulfillment team is responsible for the user journey from the moment the order is created to the completion of the trip. In this article, we will explain how we investigated these behavioral patterns and, based on them, introduced new metrics that helped make test results more interpretable.
\ This article will be useful for product analysts and product managers who work with products that have a complex, non-linear user journey, where metric interpretation requires taking behavioral patterns and repeated user actions into account.
How Do Key Metrics and Funnel Metrics Behave?
In our product, the funnel roughly looks as follows: a passenger creates an order, receives bids from drivers, selects a suitable one, waits for the driver to arrive, and then starts and completes the trip.
Imagine that we launch a small UI change: we show the user a progress bar while searching for a driver, in order to reduce uncertainty. We expect that with the progress bar, users will more often wait for driver offers and, as a result, make more trips.
\ It is logical to choose the conversion from order creation to receiving a bid as the target metric for such a test.
\ As a result of the test, we see:
- Rides count: ↑ (not statistically significant increase)
- Orders count: ↑↑ (statistically significant increase)
- CR from order to bid: ↓↓ (statistically significant decrease)
- Done rate: ↓↓ (statistically significant decrease)
\ We see a slight increase in the number of rides, a statistically significant increase in the number of orders, but at the same time, a drop in conversion from order creation to receiving a bid, and a decrease in the share of successful trips.
\ The user interacts with the feature only after creating the order, so at first glance, it seems that we could not influence the number of created orders. If the test group happened to include users who tend to create orders more often, the increase in the number of orders could distort the funnel indicators and explain the positive dynamics in rides.
\ However, a deeper analysis showed that this was not a randomization issue. After the progress bar appeared, some users who tended to wait a long time for driver offers began to cancel the order earlier and make another attempt to take a trip.
\ As a result, the number of reorders increased the most (statistically significant growth).
How Do Reorders Affect Key and Funnel Metrics?
After creating an order, a user can drop off at different stages: if they did not receive offers from drivers, if the offer price was not suitable, or later if the driver took too long to arrive. In such cases, some users do not stop trying, but create a new order to eventually get a ride. We call such repeated attempts reorders.
\ Instead of the expected linear user flow, we observe repeating cycles — users try to go through the same scenario several times.
When analyzing the efficiency of repeat attempts, we noticed that their success rate is often significantly lower. If users start reordering more often, this affects all stages of the funnel — including those that precede the actual change. At the same time, in a number of scenarios (for example, when we encourage users to try again instead of leaving), we may observe a positive effect on top-level business metrics.
Collapsing Reorders
Our goal is to understand whether users’ intentions (not individual attempts) have started to end in trips more often. To do this, we needed to give a stricter definition of a “trip intention” that would allow us to collapse multiple reorders of one user.
\ After discussions with the teams, we concluded that two orders should have the following properties in order to be considered as one intention to take a trip:
- The pickup and drop-off points of both orders should not differ significantly.
- The time of order creation should be close (orders placed within a short interval).
- The previous order must not have been completed by a trip.
\ The remaining task was to define threshold values — what should be considered “close in time” and a “small route change.” Initially, these thresholds were defined based on business needs, so the first thing we decided to do was to re-check how well these values correspond to real user behavior.
\ We found that:
- In the case of reordering, users rarely change the destination point (point B).
- The pickup point (point A) shifts more often, but in most cases, insignificantly — by about 50 meters from the original position.
- Most reorders happen within the first 10–20 minutes.
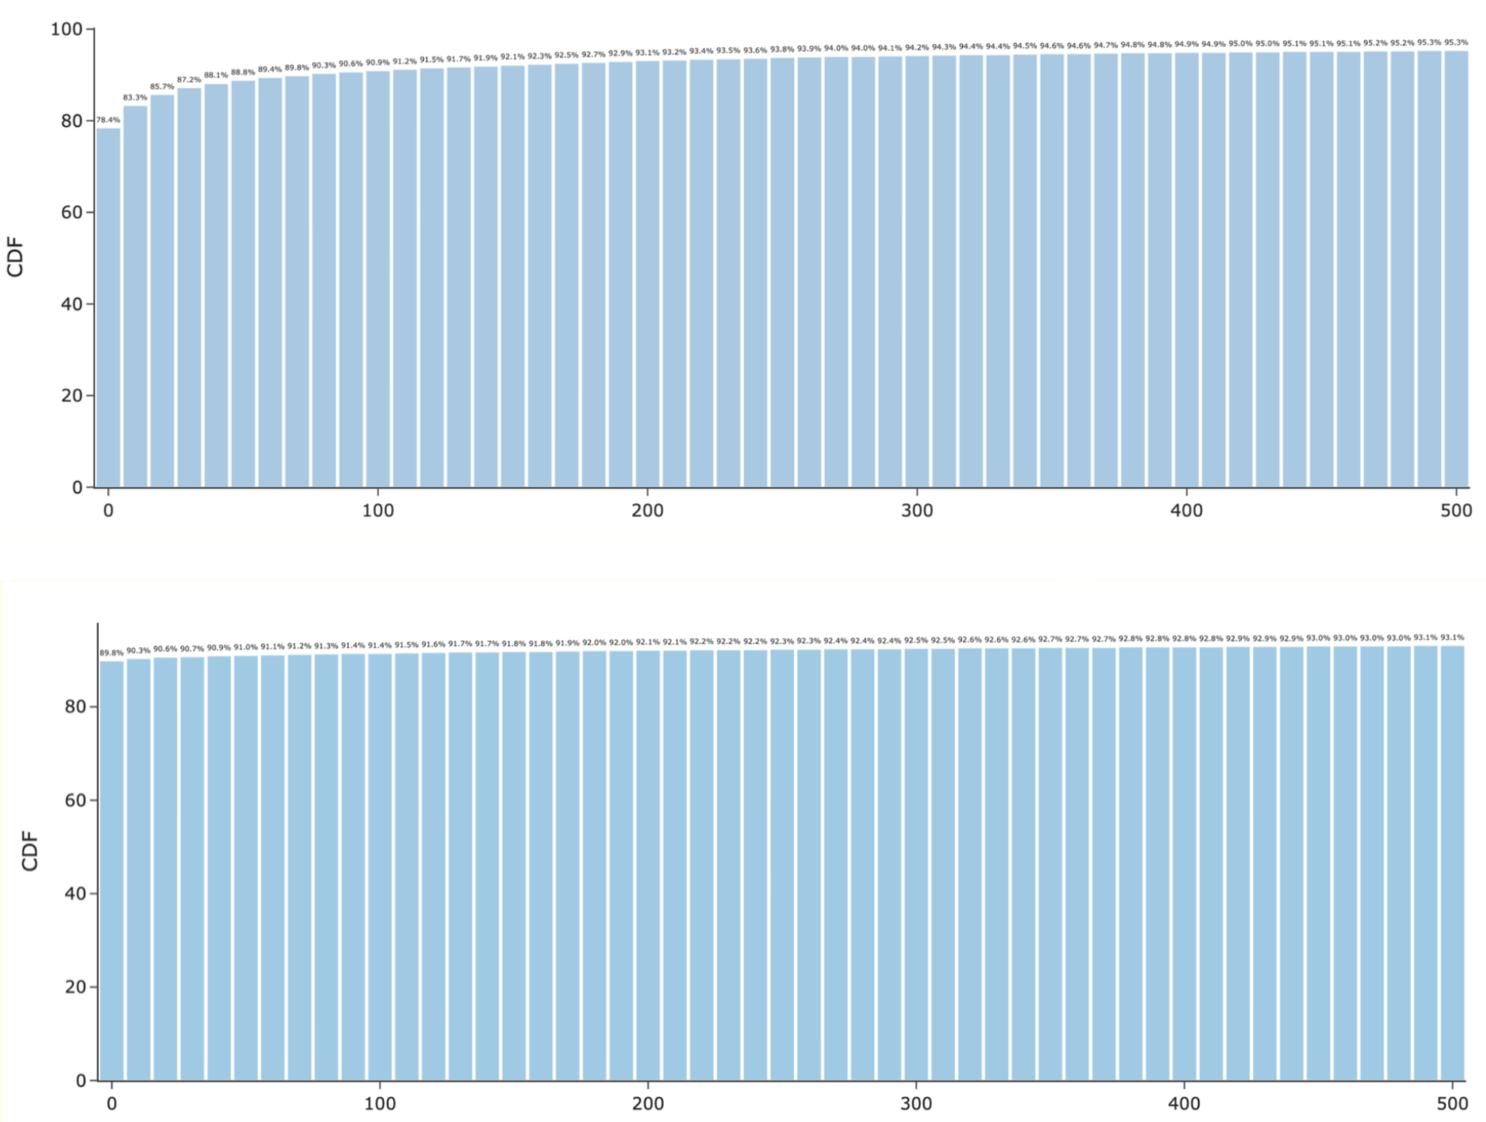
We then fixed points A and B within 500 meters and tried to see what share of reorders are made no later than X minutes.
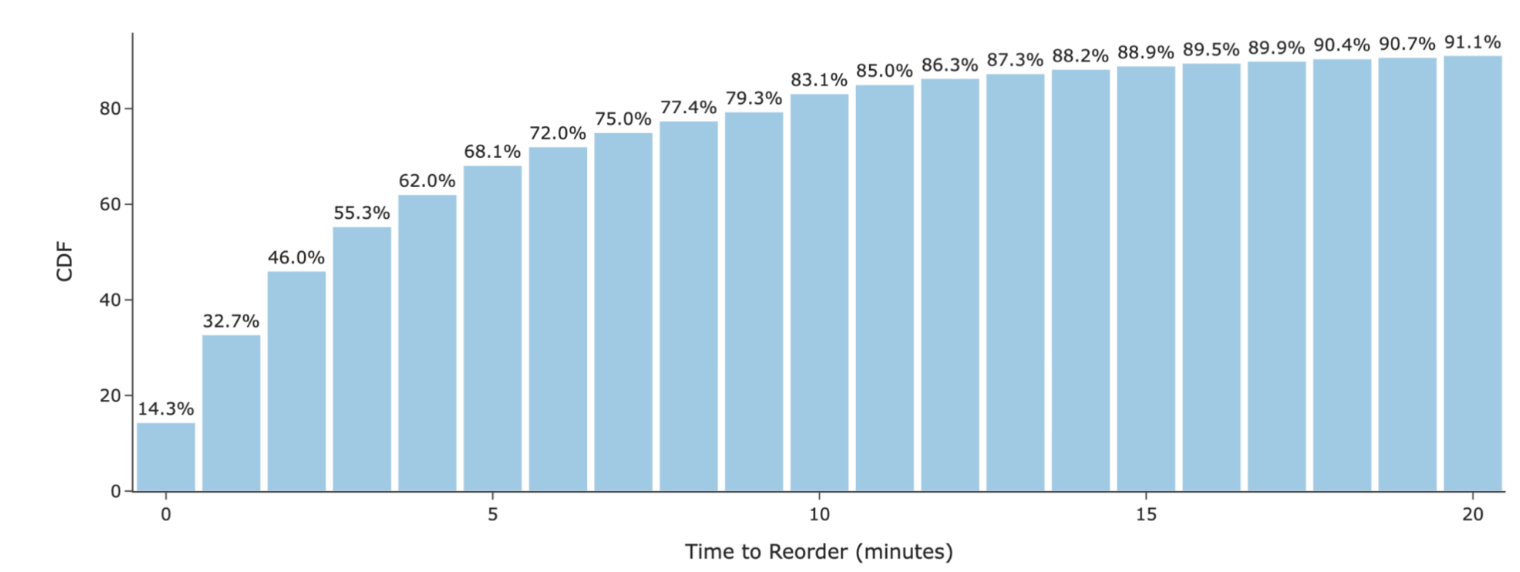
The initial cutoffs suited us well: they cover more than 90% of reorders, and further increasing the thresholds almost does not affect the coverage share.
\ In cases where a user creates three or more orders in a row, collapsing is performed sequentially: first, the first and second orders are checked and merged, then the second and third, and so on — as long as the conditions of time and location proximity are met.
Alternatives
As an alternative approach, we considered using a mobile session identifier to group orders within a single intention.
\ However, this option turned out to be less reliable for two reasons:
- A session can be interrupted or “stick”, for example, when a user places an order, then takes a trip, and soon creates and completes a new one. In such cases, session boundaries do not match real behavior.
- Mobile analytics data is less accurate than backend event times and their order can be recorded with delays or lost.
\ As a result, we decided not to use the session identifier as the basis for defining a trip intention.
New Metrics
As a result, we created a new entity and defined a rule for forming a unique identifier. The final and adopted name is “aggregated order.”
\ Based on this entity, we built several derived metrics:
- Aggregated funnel — allows us to evaluate conversions without distortions related to reorders and makes test results more interpretable.
- Funnels of the first, second, and subsequent attempts — help us understand which actions stimulate users to make a repeat attempt and increase the probability of its success.
\ Now, let’s return to the test we discussed earlier and compare the obtained values in different approaches.
| Metric | Classic Funnel | Aggregated Funnel | Interpretation | |----|----|----|----| | Rides | ↑ (not statistically significant growth) | Same counting | No change | | Orders | ↑↑ (statistically significant growth) | ~0 (not statistically significant) | The number of intentions hardly changed — the growth in orders is explained by reorders | | Done rate | ↓↓ (statistically significant drop) | ↑ (not statistically significant growth) | The shares of successful orders and successful intentions move in different directions | | Order → bid | ↓↓ (statistically significant drop) | ↓ (not statistically significant drop) | Within an intention, users began to receive bids less often; the effect is close to statistical significance |
To explain why the aggregated done rate is growing while the “order → bid” conversion is falling, we looked at how exactly users perform reorders.
\ It turned out that behavior split into two patterns:
- Some users began to stop searching faster without waiting for a bid.
- Another group, on the contrary, began to raise the price more often when reordering, and such orders were less often canceled after acceptance.
\ Additional observations:
- CR to price increase after reorder: ↑↑ (statistically significant growth)
- Aggregated bid → done: ↑↑ (statistically significant growth)
Conclusion
Sometimes, user interaction with a product cannot be fully described by classic funnel metrics. The observed results may seem contradictory, and in such cases, it is important to use metrics that reflect customers’ behavioral patterns or, as in our case, to create new entities that describe reality more accurately.
You May Also Like

TRM Labs Launches Revolutionary AI Agent for Natural Language On-Chain Analysis

Unlocking SEO, GEO & AEO: The Future of Search Optimization