

The indicators for the top of the Bitcoin bull market have become ineffective. How can we make new predictions?
Author: Bitcoin Magazine Pro
Compiled by: Plain Language Blockchain
In the recent bull market, many of the most popular Bitcoin top indicators failed to trigger, leading observers to question whether the underlying data has become "ineffective." This article analyzes some widely used tools, explores why they have underperformed in this cycle, and outlines how to adjust them to Bitcoin's evolving market structure.
Price tool prediction
On Bitcoin Magazine Pro's price prediction tool, the recent bull run has failed to reach several historically reliable top models, such as Delta Top, Terminal Price, and Top Cap (not even overnight or in the previous cycle). Bitcoin investor tools using two moving averages multiplied by 5 are also untested, and while the Pi Cycle Top indicator is closely watched by many traders, it has failed to provide accurate timing or price signals. This raises understandable questions: have these models stopped working, or has Bitcoin already surpassed them?
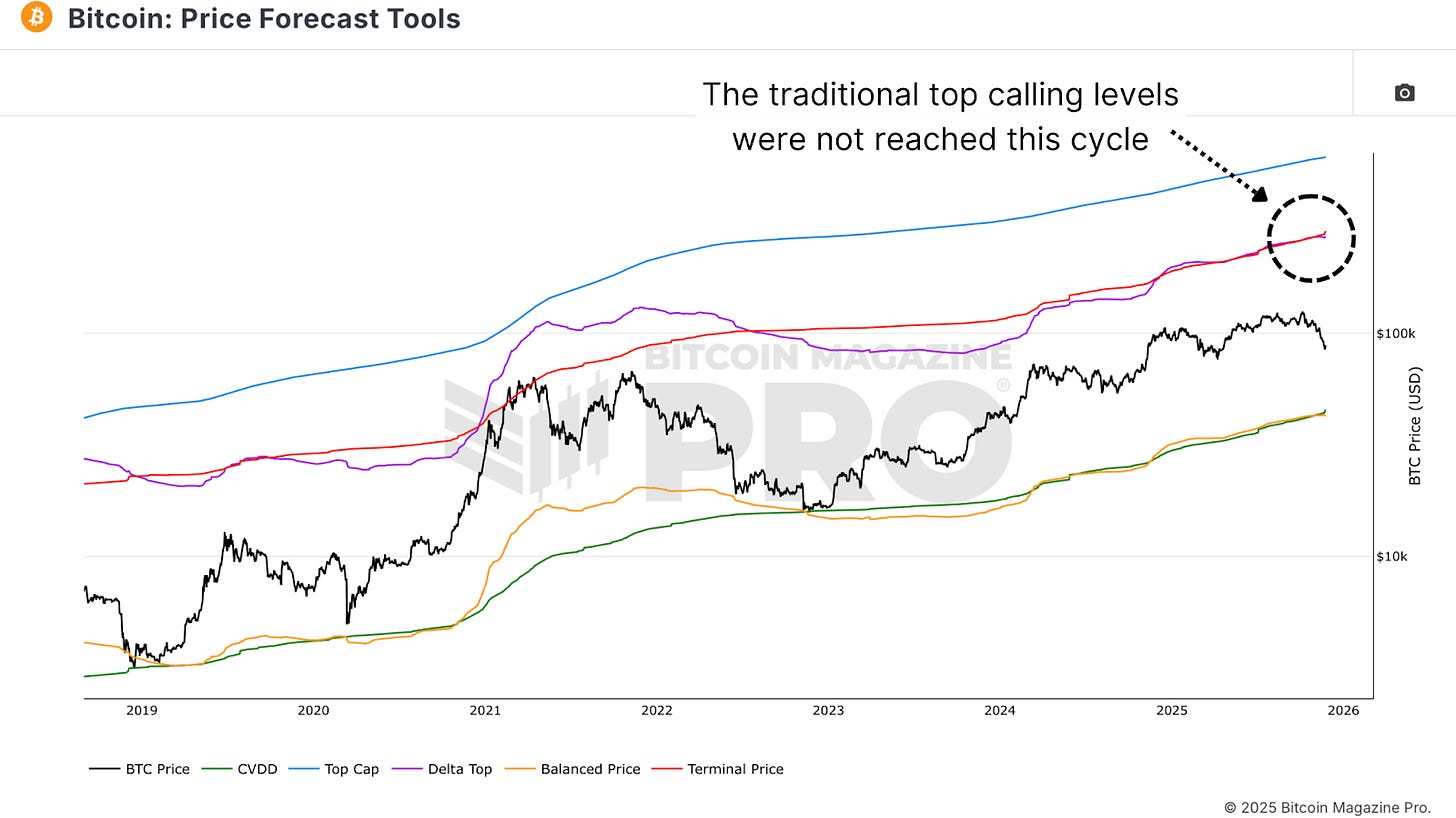 Figure 1: Historically reliable top patterns, such as Top Cap, Delta Top, and Terminal Price, have not been reached in this bull market cycle.
Bitcoin is an evolving asset; its market structure, liquidity, and participant engagement are constantly changing. Instead of assuming the data is already effective, it's more appropriate to adjust these metrics from different perspectives and timeframes. The goal is not to abandon these tools, but to make them more robust and responsive to a market that no longer offers the same early exponential rallies and cyclical tops as it did in previous years.
From fixed to dynamic
The MVRV Z-Score 2-Year Rolling Indicator has been a core tool for identifying market overheating, but it hasn't performed well in guiding the bull market's peak during this cycle. While the indicator saw a significant surge when Bitcoin first broke through the $73,000–$74,000 area, it failed to provide a clear exit signal for the subsequent rise. Currently, the indicator is at its most oversold reading on record.
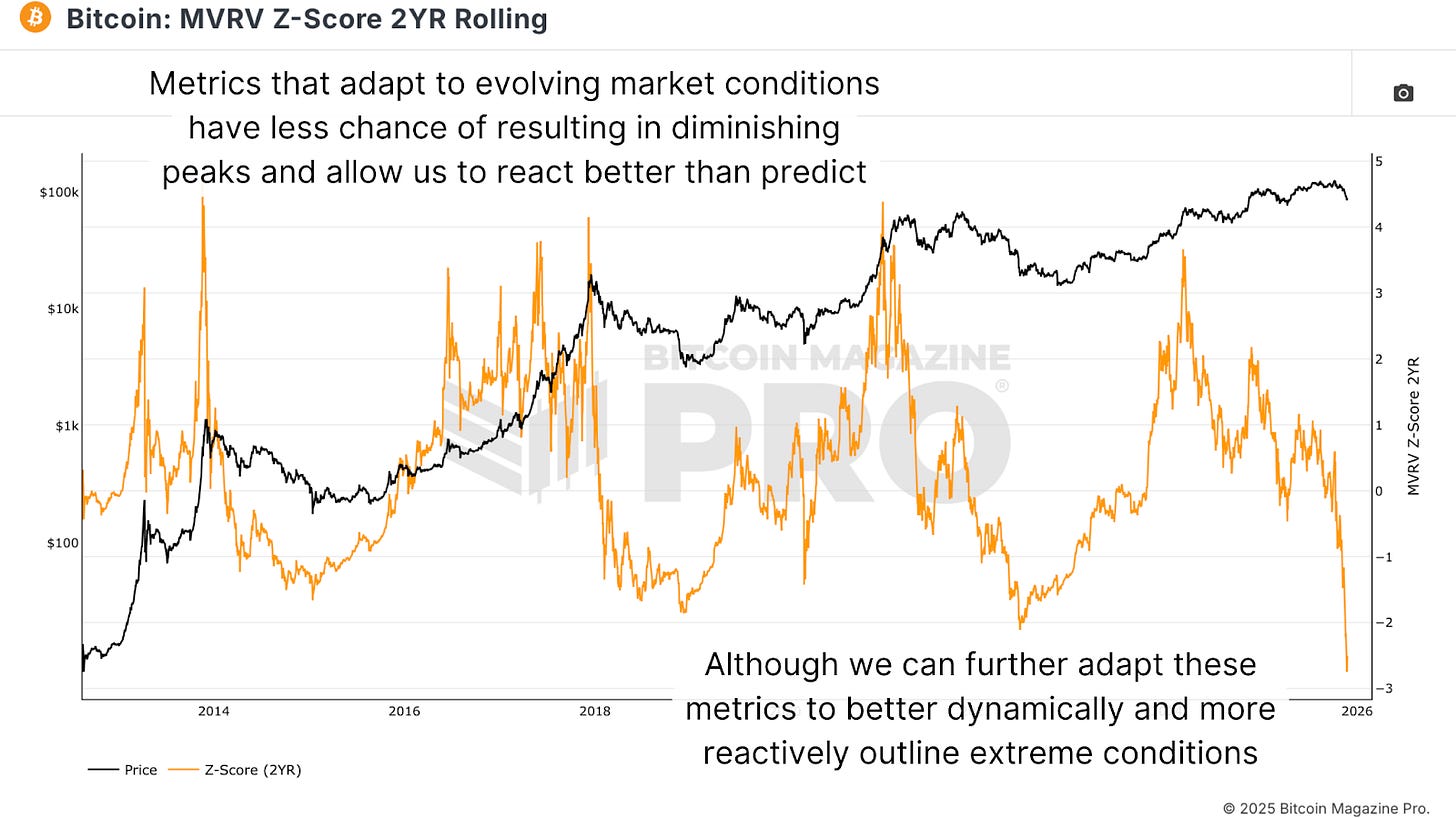 Figure 2: The normally reliable MVRV Z-Score 2-year rolling indicator failed to trigger an exit signal in the cycle.
To address this shortcoming, the MVRV Z-Score could be refactored to a 6-month rolling basis instead of two years, remaining more sensitive to recent events while grounding itself in realized value dynamics. In addition to weekly backtesting periods, abandoning fixed thresholds in favor of intervals based on a dynamic distribution is also helpful. By sparsely marking the proportion of days above or below different Z-Score levels, for example, the top 5% area and the bottom 5% can be identified. In this cycle, when Bitcoin first broke $100,000, this indicator did indeed signal in the upper limit area, and historically, moves into the top 5% area have recovered fairly well with the cycle, even if they don't capture the ideal high.
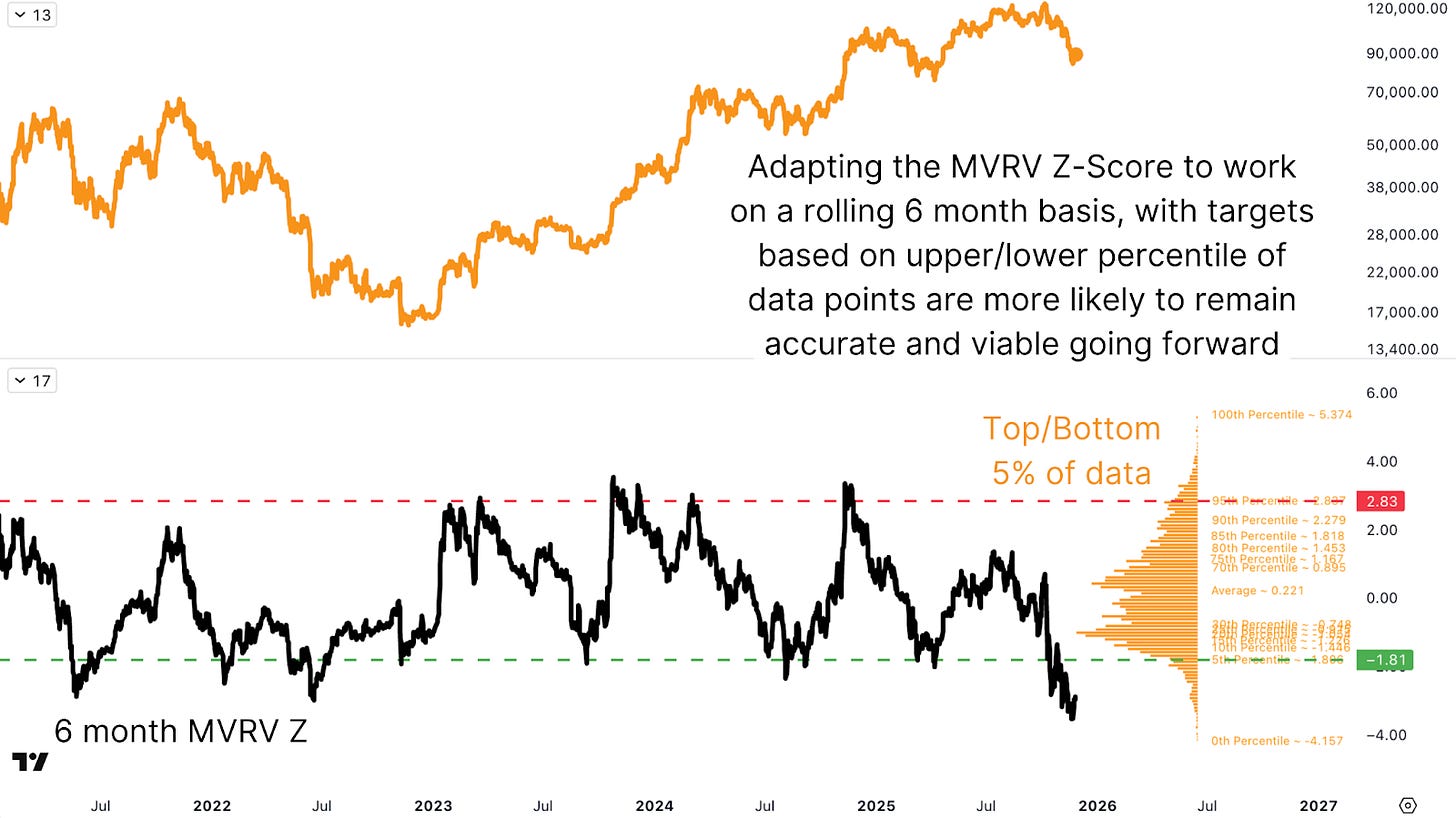 Figure 3: The recalibrated 6-month MVRV Z-Score, with targeted upper and lower percentages, provides more timely buy/sell signals.
Faster reaction
Beyond valuation tools, activity-based metrics like Coin Days Destroyed can enhance their utility by looking back over the entire cycle. Historically, the 90-day moving average of Coin Days Destroyed has tracked large-scale sell-offs by long-term holders, but due to the more cautious and volatile movements of the current cycle, the 30-day moving average often provides more valuable information. Since Bitcoin is no longer offering the same parabolic rallies, metrics need to react more quickly to reflect shallower, but still important, profit-taking and investor rotation waves.
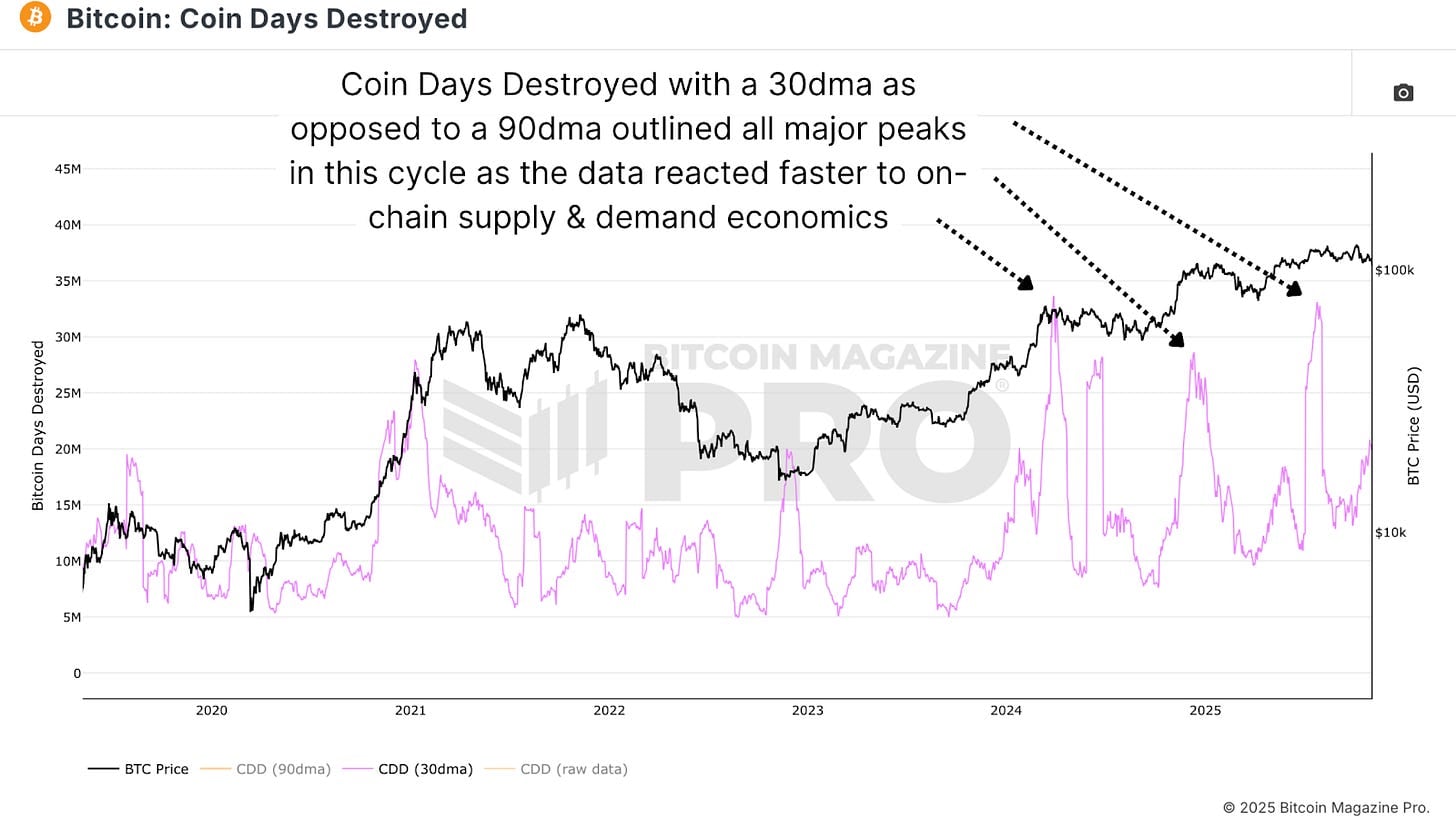 Figure 4: It turns out that the 30-day moving average coin push measurement reacts to on-chain dynamics faster.
The 30-day CoinMarket Intelligence indicator, which corrects recent readings and may trigger a rally before reaching new all-time highs in this cycle, was triggered almost at the cycle's peak. It was triggered when Bitcoin first crossed around $73,000–74,000 and broke through $100,000, effectively marking all the key selling waves. While this is easily observed in hindsight, it reinforces the idea that on-chain supply and demand signals remain relevant; the task is to infer them based on current volatility and market depth.
SOPR (Sum of Expenditure Ratio)
The Spend-Output Profit Margin (SOPR) provides another perspective on realized profit and loss, but the raw data column can be messy, with spikes in volatility, mean reversion of profits and losses, and significant fluctuations during rallies and mid-bull market capitulation. To extract more actionable information, the SOPR can be corrected using a 28-day (monthly) change. This smoothed alternative highlights the trend within a short-term window, ultimately leading to cyclical fluctuations when the trend reaches extreme levels.
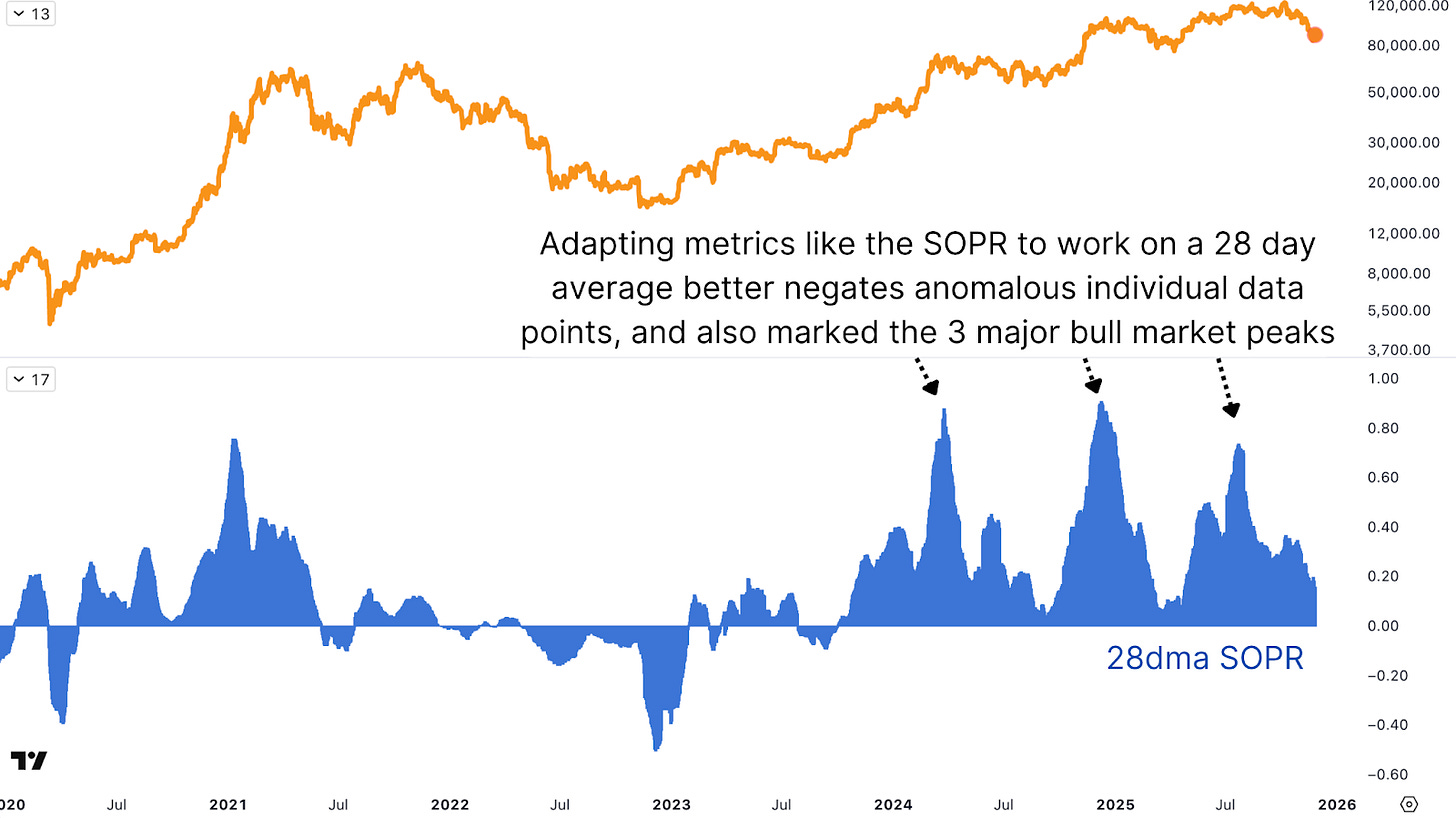 Figure 5: Applying a 28-day moving average to the SOPR indicator can smooth the data, reduce unnecessary "noise," and accurately identify local tops.
Assessing recent cycles, the monthly SOPR change produced significant peaks when Bitcoin first broke through the $73,000–$74,000 area, again broke through $100,000, and near the $120,000 area. While none of these perfectly captured the final high, they all strongly suggested the end of a pressure phase, consistent with cyclical fatigue. Using monthly changes instead of raw indicators makes the signal clearer, especially when viewed across assets, such as Bitcoin's purchasing power against stocks and gold.
in conclusion
In hindsight, the topping indicators that were popular throughout the bull market did indeed work when simplified with the right perspective and appropriate timeframe. The key principle remains: react to the data, don't try to predict. Instead of waiting for any single indicator to perfectly predict the top, use a basket of adjusted indicator labels and interpret them through the lens of force and ever-changing market dynamics. This increases the probability of identifying when Bitcoin overheated and when it transitioned to a more favorable accumulation phase. The focus in the coming months will be on refining these models to ensure they remain reliably accurate not only historically but also in the future.


You May Also Like

ETH Enters High-Stakes Decision Zone

Why your innovative ‘culture hack’ won’t save you — Ahmad Ibrahim

Japanese Tech Giant’s Ambitious Bitcoin Accumulation


