The post Are Bitcoin Whales Buying the Dip? On-Chain Data Reveals Their Next Move appeared first on Coinpedia Fintech News The latest drop in the Bitcoin price has surprised the traders, as they were expecting a rise above $95,000 after a brief consolidation. The token broke down below the psychological barrier at $86,800, forming an intraday low at $84,756. The recent drop has also sparked a big question across the market: Are whales buying this …The post Are Bitcoin Whales Buying the Dip? On-Chain Data Reveals Their Next Move appeared first on Coinpedia Fintech News The latest drop in the Bitcoin price has surprised the traders, as they were expecting a rise above $95,000 after a brief consolidation. The token broke down below the psychological barrier at $86,800, forming an intraday low at $84,756. The recent drop has also sparked a big question across the market: Are whales buying this …

Are Bitcoin Whales Buying the Dip? On-Chain Data Reveals Their Next Move

2025/12/01 23:32
3 min read
For feedback or concerns regarding this content, please contact us at crypto.news@mexc.com
Bitcoin OG Whales Are Taking Profits Dumping $1.1B As BTC Prices Hit $107K

The post Are Bitcoin Whales Buying the Dip? On-Chain Data Reveals Their Next Move appeared first on Coinpedia Fintech News

The latest drop in the Bitcoin price has surprised the traders, as they were expecting a rise above $95,000 after a brief consolidation. The token broke down below the psychological barrier at $86,800, forming an intraday low at $84,756. The recent drop has also sparked a big question across the market: Are whales buying this dip or stepping back? 

Fresh on-chain data shows that while whales are not panic-selling, they are being highly selective about where they accumulate. Let’s break it down. 

Whales Haven’t Panicked—They’re Waiting for Better Prices

One of the strongest indicators of whale behavior during the corrections is where their cost basis clusters sit. The data below shows that the large BTC holders have not dumped their coins during the latest correction, instead waiting for the price to fall into their preferred buying zones. The Bitcoin Cost Basis Distribution Heatmap shows the star token has dropped into a major whale accumulation zone. 

bitcoin price

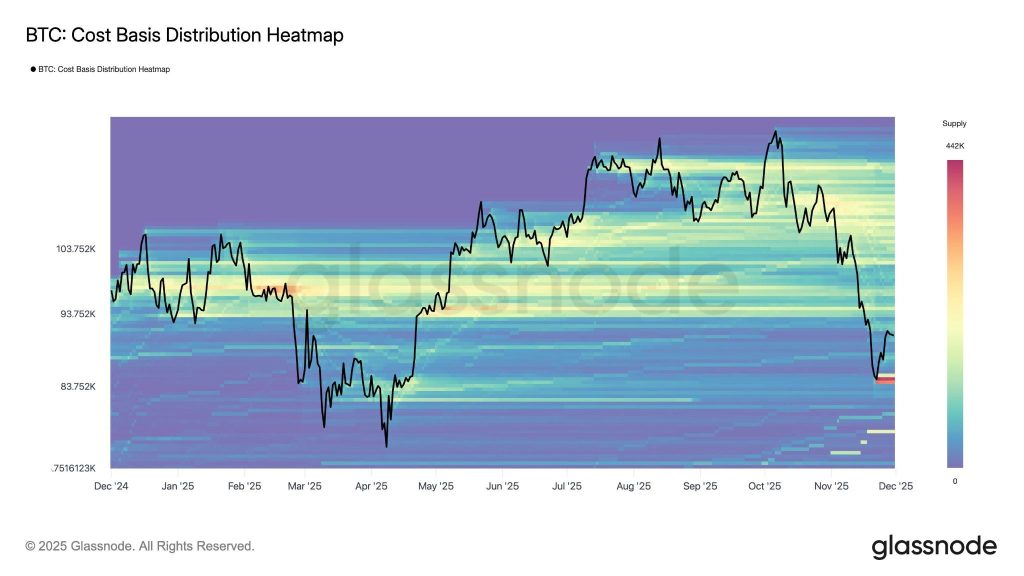
The Glassnode data highlights where a large amount of supply last moved. According to the chart, heavy whale cost-basis clusters sit between $83,000 and $88,000, meaning whales are likely preparing to accumulate again if the price stays in this region. The most compelling signal isn’t where whales bought before, but it’s what they are doing now. The latest part of the heatmap shows a new cluster forming near the recent lows, suggesting the whales could begin to accumulate again. 

This behavior aligns with previous accumulation cycles, where whales steadily buy into weakness while retail holds back. 

Are Whales Accumulating Bitcoin?

The above chart suggests the whales may have begun to accumulate again, but the whale address indicates the action is yet to start. The addresses holding more than 1000 Bitcoin faced a significant downfall just before the current pullback. Presently, the levels have stabilized, but a rise in the total BTC held by large wallets may trigger a strong recovery in the Bitcoin price. 

bitcoin price

If accumulation continues in this zone, Bitcoin may be forming a structural bottom. Historically, whale cost-basis layers act as springboards once the market stabilizes and liquidity returns. A resumption of buying in this band typically precedes:

  • a reduction in selling pressure,
  • a gradual reclaim of resistance levels, and
  • a medium-term trend reversal.

If this chart begins to trend upward again, it means whales are actively buying the dip—historically a strong bullish signal.

Here’s What Could be the Next BTC Price Action

The current pullback has validated the bearish pressure on the token, as the BTC price has confirmed its third lower high and low following a rejection at the ATH. Despite multiple attempts, the bulls have failed to initiate a recovery above $87,000. This suggests BTC price is prone to more deeper correction in the next few days, which may break the $80,000 support range. 

bitcoin price

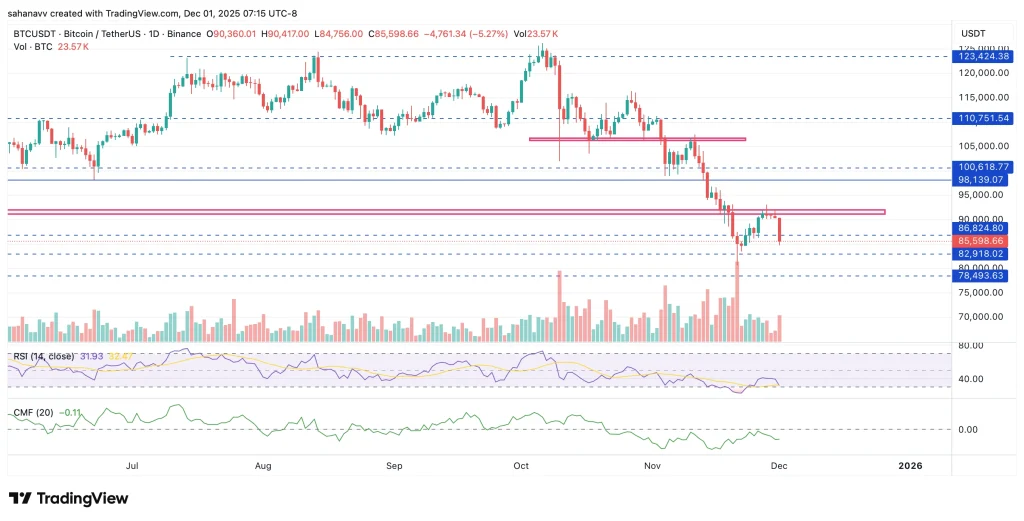
As seen in the above chart, the RSI surged from the overbought zone but is preparing to enter back into the same range. However, the Chaikin Money Flow (CMF) has displayed a bullish divergence, despite being within the negative range, indicating a significant influx of liquidity. Moreover, the Bollinger bands have also begun to squeeze, suggesting the token is preparing for a big move. 

Therefore, in the coming days, one can expect the Bitcoin (BTC) price to touch the support at $82,918 that may initiate a recovery. However, a strong whale accumulation and bullish activity may only reinstate the Bitcoin bull run, and until then, the token may continue to form lower highs and lows. 

Market Opportunity
Movement Logo
Movement Price(MOVE)
$0.01941
$0.01941$0.01941
+0.51%
USD
Movement (MOVE) Live Price Chart
Disclaimer: The articles reposted on this site are sourced from public platforms and are provided for informational purposes only. They do not necessarily reflect the views of MEXC. All rights remain with the original authors. If you believe any content infringes on third-party rights, please contact crypto.news@mexc.com for removal. MEXC makes no guarantees regarding the accuracy, completeness, or timeliness of the content and is not responsible for any actions taken based on the information provided. The content does not constitute financial, legal, or other professional advice, nor should it be considered a recommendation or endorsement by MEXC.

You May Also Like

Siren (SIREN) Crashes 56% in 24 Hours Despite Strong Monthly Performance

Siren (SIREN) Crashes 56% in 24 Hours Despite Strong Monthly Performance

Siren (SIREN) experienced a dramatic 56.3% price collapse in 24 hours, dropping from $2.56 to $1.02, while paradoxically maintaining 290% monthly gains. Our data
Share
Blockchainmagazine2026/03/25 07:04
Loopring (LRC) Price Prediction 2026-2030: Critical Analysis of Recovery Potential and Market Trajectory

Loopring (LRC) Price Prediction 2026-2030: Critical Analysis of Recovery Potential and Market Trajectory

BitcoinWorld Loopring (LRC) Price Prediction 2026-2030: Critical Analysis of Recovery Potential and Market Trajectory As the cryptocurrency market continues its
Share
bitcoinworld2026/03/25 07:35
7 Top Meme Coins That Could Explode

7 Top Meme Coins That Could Explode

The post 7 Top Meme Coins That Could Explode appeared on BitcoinEthereumNews.com. Meme coins have rewritten the rules of crypto, turning jokes, internet culture, and viral energy into billion-dollar movements. From Dogecoin’s playful beginnings to Shiba Inu’s explosive rise, meme coins have proven they’re more than passing trends; they’re cultural currencies powered by community conviction. Today’s market is filled with standouts like Brett, Apecoin, Mog Coin, Snek, Turbo, and Cat in a Dog’s World, each adding its own flavor of humor, hype, and creativity to the crypto space. However, the name that is currently dominating conversations is MoonBull. With its presale gaining momentum and investors rushing to grab their share before the next price jump, MoonBull is quickly positioning itself as the top meme coin to watch in 2025. What sets it apart isn’t just community energy; it’s the built-in mechanics, massive ROI potential, and focus on rewarding holders that are already fueling early-stage FOMO. While other meme coins carry their own weight, MoonBull’s presale fire is what’s catching everyone’s eye. How MoonBull’s Tokenomics Could Make It the Next Top Meme Coin The MoonBull presale is gaining serious momentum, quickly positioning itself as a top meme coin to watch in 2025. Early buyers are rushing in to secure their share before prices climb in the next stages, driven by a design that rewards conviction and community growth. Once MoonBull hits the market, every sell order does more than just exchange tokens; it actively fuels the token’s upward trajectory. With 2% of each sale bolstering the liquidity pool, the market becomes deeper and more resilient, smoothing out volatility and giving buyers confidence that there’s always a strong foundation beneath the price. Simultaneously, 2% of each sale flows back into holders’ wallets, meaning every trade rewards loyal participants and compounds their positions without any extra effort. The final 1% is forever removed from circulation,…
Share
BitcoinEthereumNews2025/09/27 22:53