Pi Network price weakens as fading bullish volume puts pressure on key support levels, raising the risk of a correction toward the $0.20 value area low.Pi Network price weakens as fading bullish volume puts pressure on key support levels, raising the risk of a correction toward the $0.20 value area low.

Pi Network price risks crash to $0.20 as bullish volume fades

2025/12/01 22:20
3 min read

Pi Network price weakens as fading bullish volume puts pressure on key support levels, raising the risk of a correction toward the $0.20 value area low.

Summary
  • Bullish volume is fading at the $0.22 point of control.
  • Liquidity under support suggests a sweep toward $0.20.
  • A bounce from $0.20 could trigger a rotation back to $0.25.

Pi Network’s (PI) price action is beginning to show signs of exhaustion as bullish volume continues to fade across key support regions. Despite briefly stabilizing above the point of control (POC) at $0.22, momentum has weakened, raising concerns that a deeper correction may be forming. 

With 190 million tokens preparing to unlock, many traders are also questioning whether this event could amplify downside pressure and accelerate the ongoing weakness. With the underlying structure slipping and liquidity building below support, Pi Network faces a critical moment in its short-term market outlook.

Pi Network price key technical points

  • Price is trading around the $0.22 point of control with weak bullish volume.
  • Fading momentum increases the probability of a drop toward the $0.20 value area low.
  • Liquidity resting under the POC suggests downside wicking before any potential recovery.
Pi Network price risks crash to $0.20 as bullish volume fades - 1

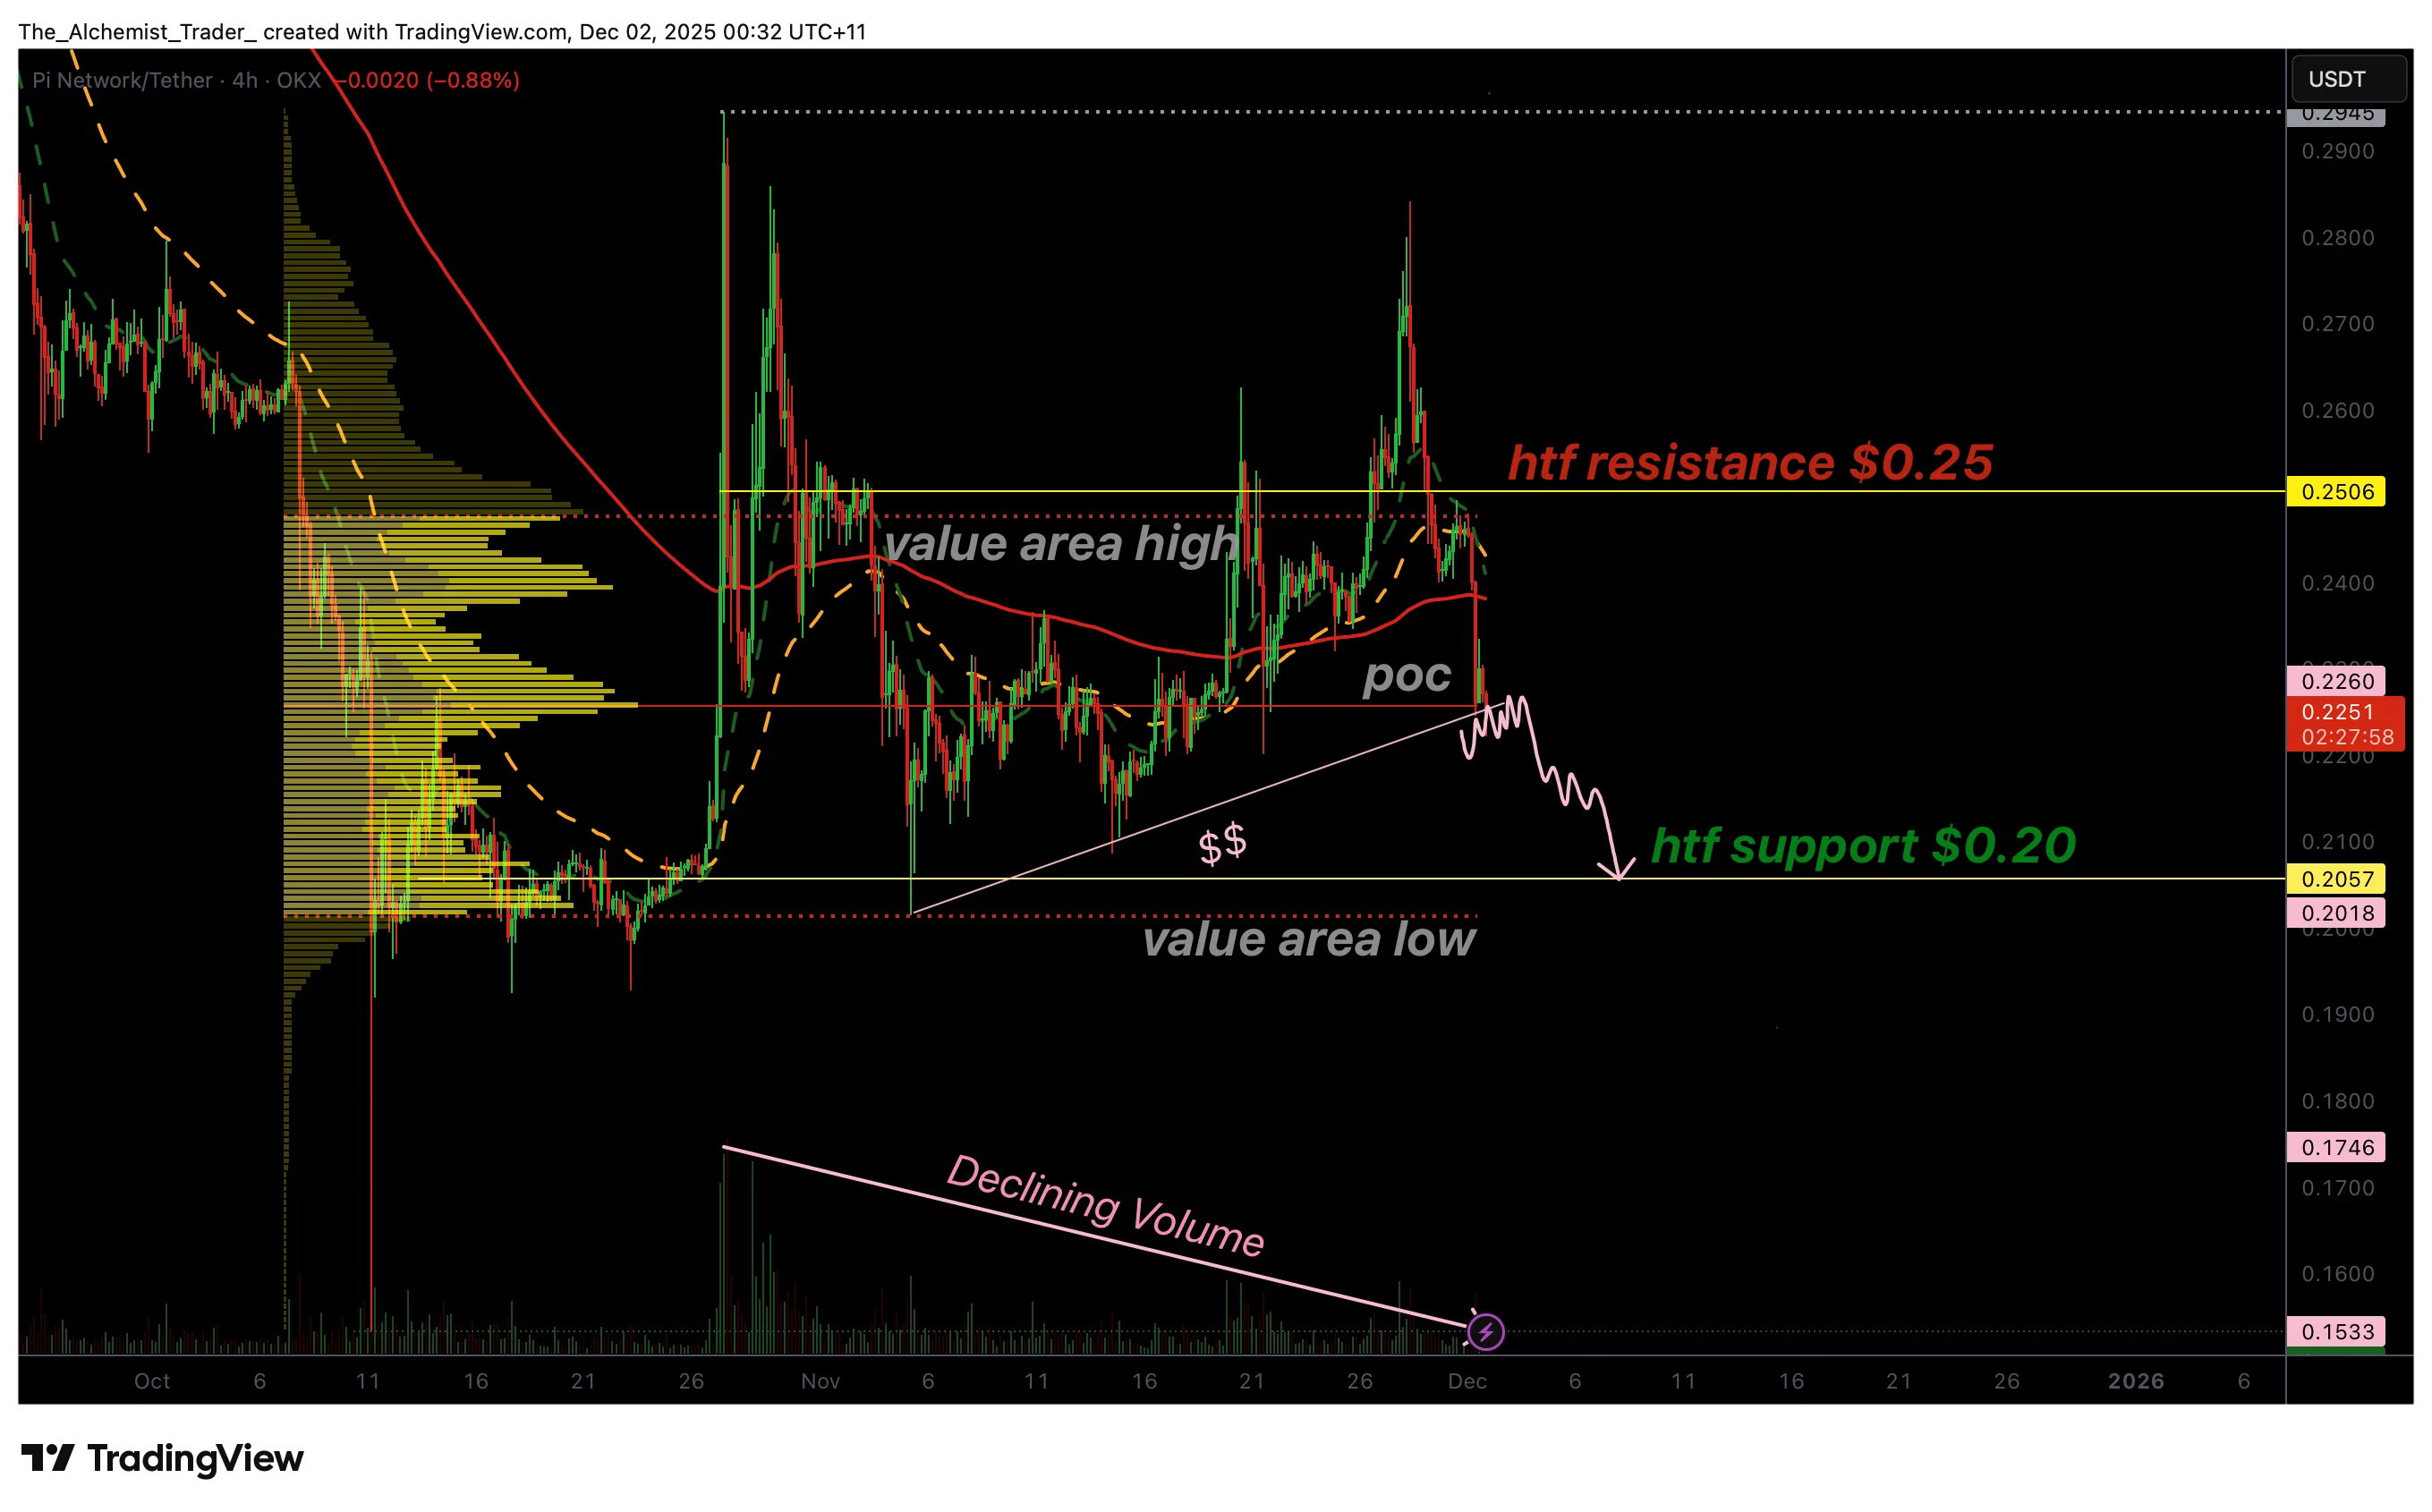
Pi Network has recently retreated toward the point of control near $0.22, a level that has underpinned the current trading range. Unlike earlier retests, when substantial bullish volume supported clean rebounds, the latest interaction with this region has shown notably weaker demand. This shift marks one of the most explicit early warnings that buyers are losing control of the narrative.

Although price has printed a series of higher lows around the POC, this behaviour does not reflect expanding strength. Instead, it suggests liquidity buildup beneath the support shelf. When liquidity pools form under a key level, markets tend to wick or sweep downward to collect these orders before establishing any meaningful reversal. For Pi Network, this increases the likelihood of a liquidity sweep under $0.22.

If the market does break below this shelf, the next major technical support sits at $0.20, which aligns cleanly with the value area low of the current range. This level represents a strong structural demand zone and would be the natural target in a deeper corrective phase. A corrective dip toward $0.20 could reset the structure and potentially trigger a rotation back toward the POC at $0.22, and eventually the upper range resistance at $0.25.

At this stage, the point of control remains the most critical support. Holding above $0.22 would preserve the current range structure. Pi Network’s recent strategic investment in CiDi Games also adds a layer of broader ecosystem development, but it has yet to influence short-term price dynamics. 

However, the combination of fading bullish volume and rising liquidity below support increases the probability of a sharper corrective move toward $0.20 in the short term.

What to expect in the coming price action

If bullish volume does not return soon, Pi Network is likely to sweep liquidity beneath $0.22 and test the $0.20 support level. A strong defense of $0.20 could allow the price to re-enter its range and attempt a move back toward $0.25.

Market Opportunity
Pi Network Logo
Pi Network Price(PI)
$0.1462
$0.1462$0.1462
+0.77%
USD
Pi Network (PI) Live Price Chart
Disclaimer: The articles reposted on this site are sourced from public platforms and are provided for informational purposes only. They do not necessarily reflect the views of MEXC. All rights remain with the original authors. If you believe any content infringes on third-party rights, please contact service@support.mexc.com for removal. MEXC makes no guarantees regarding the accuracy, completeness, or timeliness of the content and is not responsible for any actions taken based on the information provided. The content does not constitute financial, legal, or other professional advice, nor should it be considered a recommendation or endorsement by MEXC.

You May Also Like

Microsoft Corp. $MSFT blue box area offers a buying opportunity

Microsoft Corp. $MSFT blue box area offers a buying opportunity

The post Microsoft Corp. $MSFT blue box area offers a buying opportunity appeared on BitcoinEthereumNews.com. In today’s article, we’ll examine the recent performance of Microsoft Corp. ($MSFT) through the lens of Elliott Wave Theory. We’ll review how the rally from the April 07, 2025 low unfolded as a 5-wave impulse followed by a 3-swing correction (ABC) and discuss our forecast for the next move. Let’s dive into the structure and expectations for this stock. Five wave impulse structure + ABC + WXY correction $MSFT 8H Elliott Wave chart 9.04.2025 In the 8-hour Elliott Wave count from Sep 04, 2025, we saw that $MSFT completed a 5-wave impulsive cycle at red III. As expected, this initial wave prompted a pullback. We anticipated this pullback to unfold in 3 swings and find buyers in the equal legs area between $497.02 and $471.06 This setup aligns with a typical Elliott Wave correction pattern (ABC), in which the market pauses briefly before resuming its primary trend. $MSFT 8H Elliott Wave chart 7.14.2025 The update, 10 days later, shows the stock finding support from the equal legs area as predicted allowing traders to get risk free. The stock is expected to bounce towards 525 – 532 before deciding if the bounce is a connector or the next leg higher. A break into new ATHs will confirm the latter and can see it trade higher towards 570 – 593 area. Until then, traders should get risk free and protect their capital in case of a WXY double correction. Conclusion In conclusion, our Elliott Wave analysis of Microsoft Corp. ($MSFT) suggested that it remains supported against April 07, 2025 lows and bounce from the blue box area. In the meantime, keep an eye out for any corrective pullbacks that may offer entry opportunities. By applying Elliott Wave Theory, traders can better anticipate the structure of upcoming moves and enhance risk management in volatile markets. Source: https://www.fxstreet.com/news/microsoft-corp-msft-blue-box-area-offers-a-buying-opportunity-202509171323
Share
BitcoinEthereumNews2025/09/18 03:50
XRP Buyers Defend Most Major 200-Week Price Average: Can It Be Bottom of 2026?

XRP Buyers Defend Most Major 200-Week Price Average: Can It Be Bottom of 2026?

The post XRP Buyers Defend Most Major 200-Week Price Average: Can It Be Bottom of 2026? appeared on BitcoinEthereumNews.com. XRP has returned to its 200-week moving
Share
BitcoinEthereumNews2026/02/08 19:49
Expert Tags Ethereum’s ERC-8004 Mainnet Launch An “iPhone Moment”, Here’s What It Means

Expert Tags Ethereum’s ERC-8004 Mainnet Launch An “iPhone Moment”, Here’s What It Means

Market analyst says Ethereum is having an “iPhone moment” as it approaches the ERC-8004 mainnet launch.
Share
Coinstats2026/02/08 19:56