

Stellar crypto outlook: can XLM recover from oversold lows?
 Stellar crypto is trading in a fragile spot, with XLM against USDT slipping into a clearly defensive posture. However, the current structure also hints at the early stages of a potential base-building phase, as volatility contracts and intraday flows try to stabilize. In what follows, we will map out where the asset stands now and what conditions would be required for a more constructive reversal.
 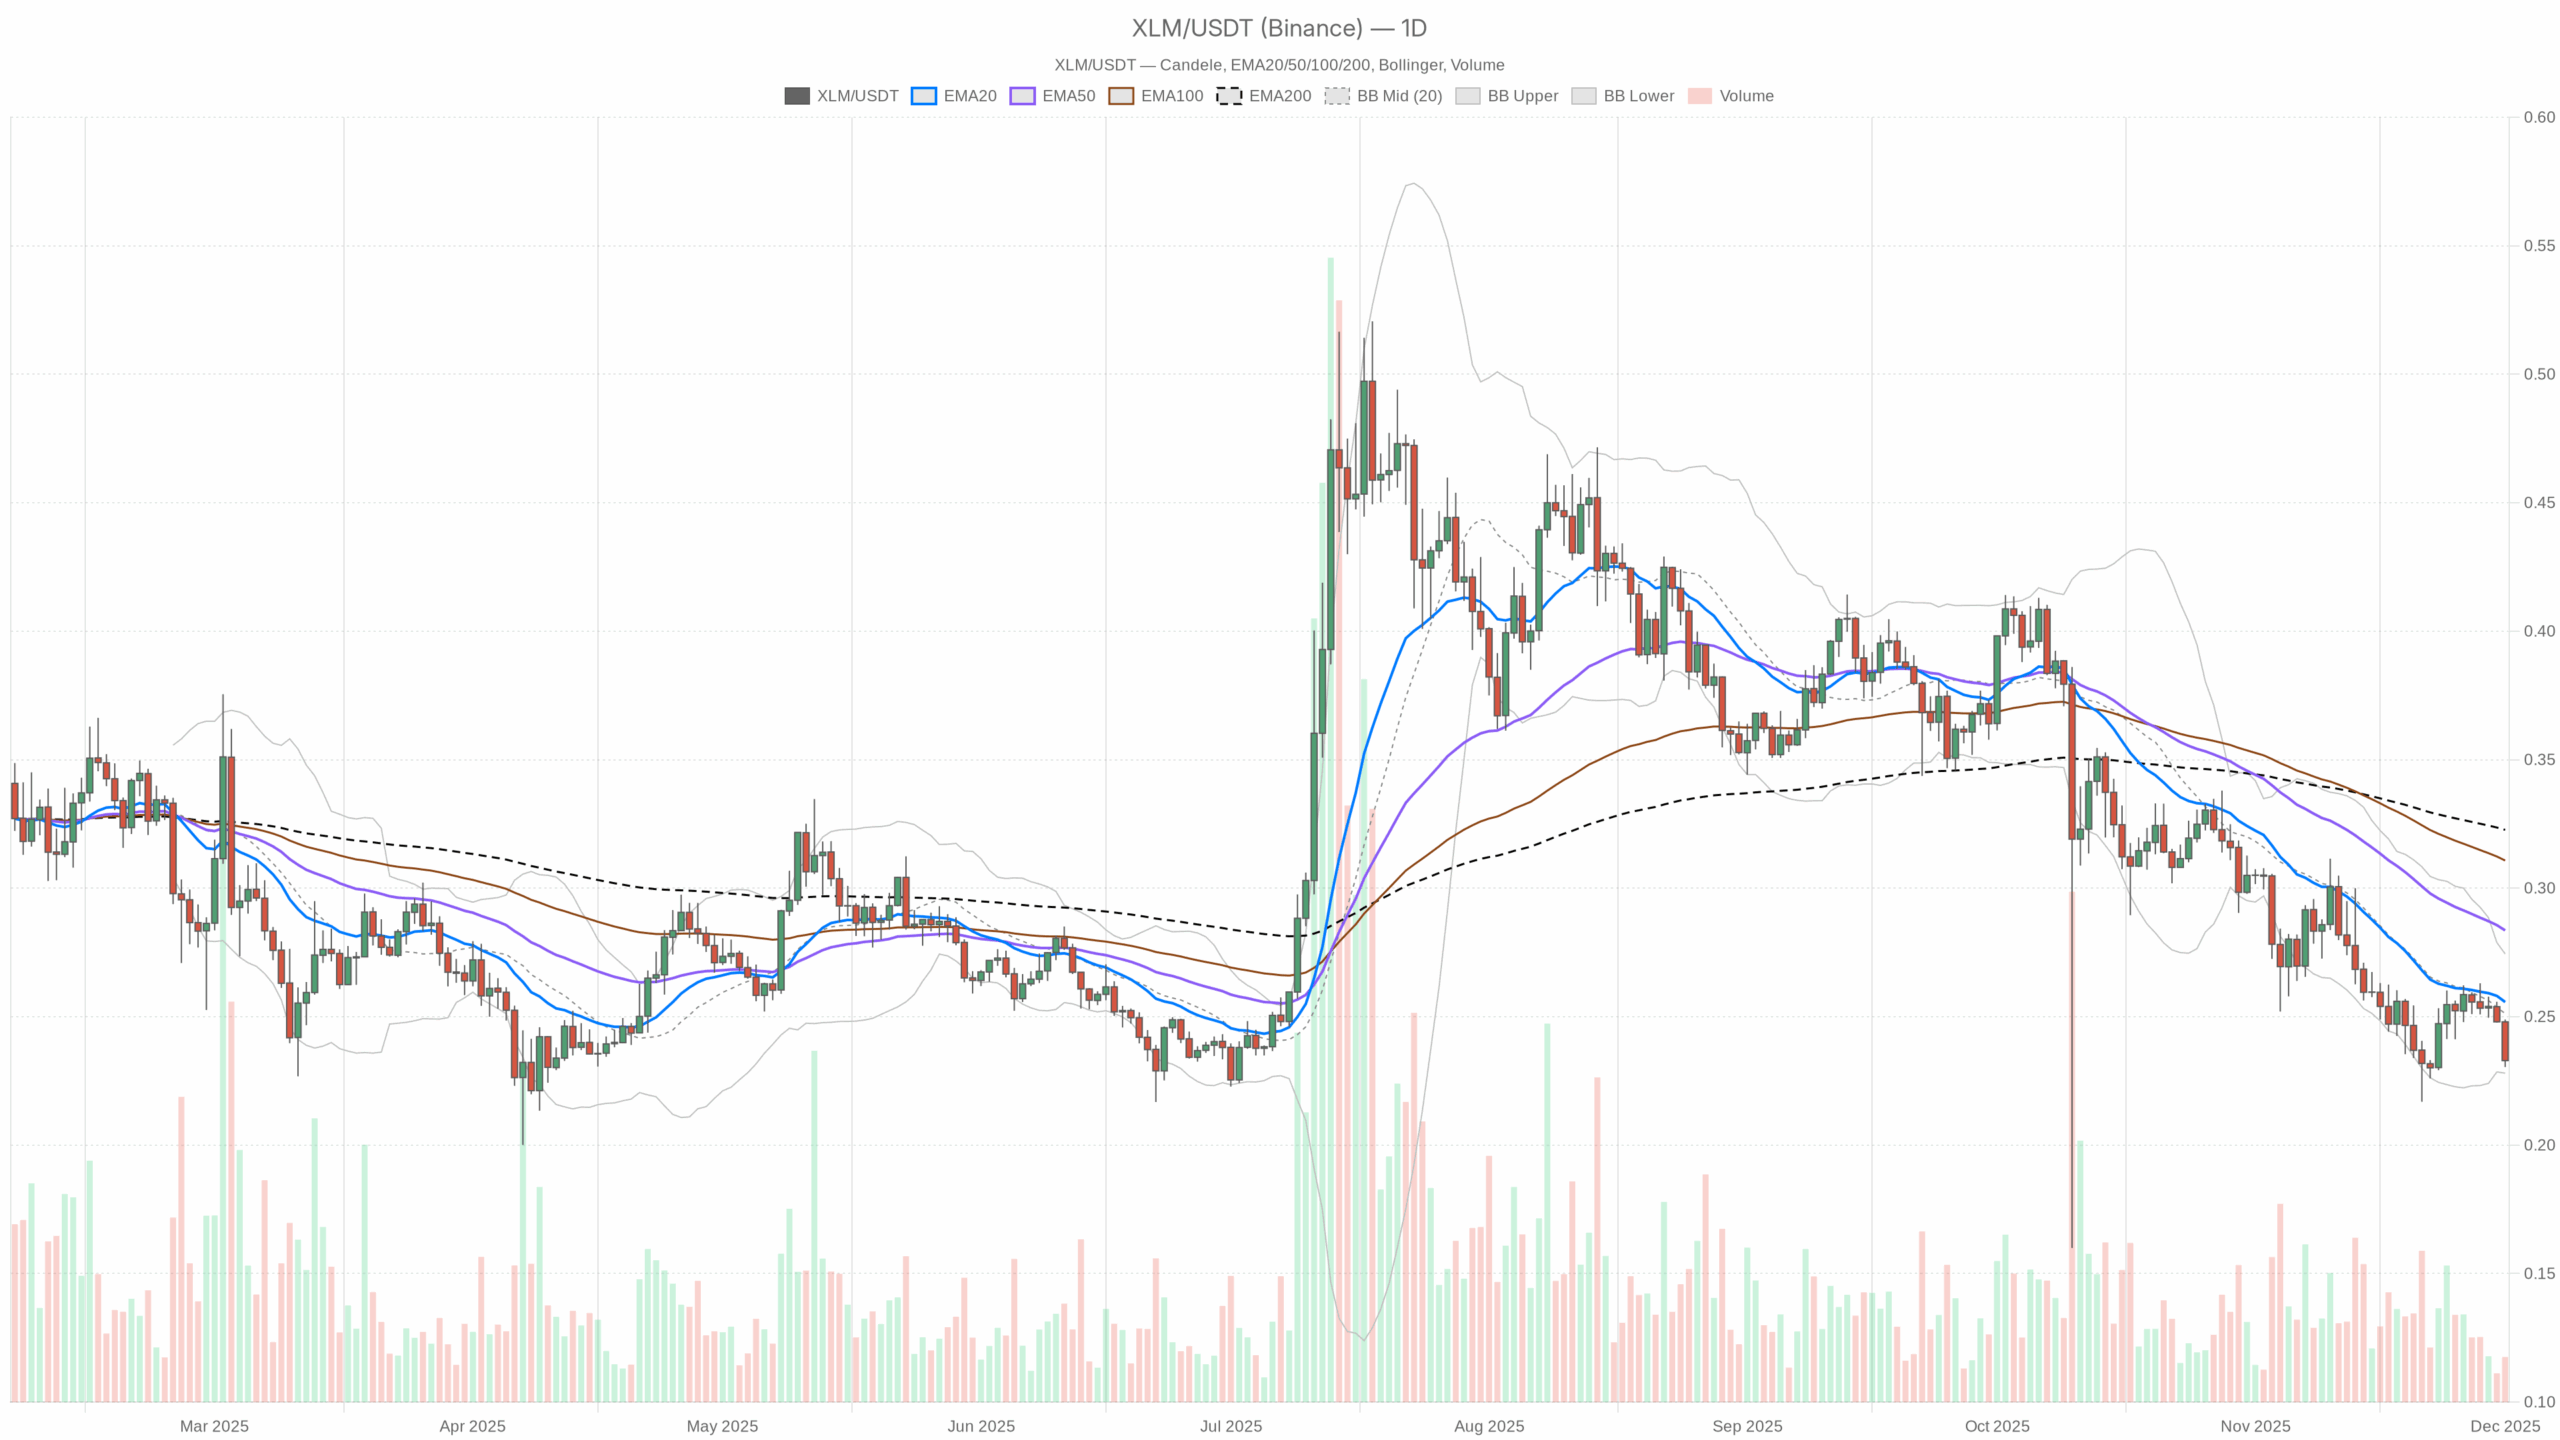 XLM/USDT — daily chart with candlesticks, EMA20/EMA50 and volume.
Summary
The daily chart shows a firmly bearish market regime, with price below the 20, 50, and 200-day EMAs. Momentum is weak, as the daily RSI sits in the low 30s, close to oversold territory but not yet washed out. Moreover, MACD is negative yet flat, pointing to trend fatigue rather than an aggressive new leg lower. Bollinger Bands have narrowed, suggesting volatility compression after the recent slide. The broader crypto market is under pressure, with total capitalization down almost 5% in 24 hours. Meanwhile, sentiment is dominated by Extreme Fear, which often coincides with forced selling and poor liquidity, but can also precede medium-term opportunities.
Stellar crypto: Market Context and Direction
The macro backdrop for altcoins is uncomfortable. Bitcoin commands about 57% dominance, a level that typically leaves little room for capital to rotate meaningfully into secondary names like XLM. Moreover, total crypto capitalization stands near 3.03 trillion dollars and has fallen by roughly 4.9% in a single day, underscoring a risk-off adjustment across the board.
The Fear & Greed Index prints at 24, firmly in Extreme Fear. Historically, such readings often emerge when participants are already de-risking, cutting leverage, or abandoning speculative positions. That said, extreme readings do not guarantee an immediate rebound; they simply indicate that the majority of traders are positioned defensively. For XLM, this combination of high Bitcoin dominance and fearful sentiment reinforces the current downtrend confirmation, but also plants the seeds for a contrarian narrative should selling pressure start to exhaust.
Technical Outlook: reading the overall setup
On the daily timeframe, XLMUSDT closes around 0.23 dollars, trading decisively below the 20-day EMA at 0.26, the 50-day EMA at 0.28, and the 200-day EMA at 0.32. This triple alignment of moving averages above price reflects a mature downtrend structure; bears still control rallies, and any bounce into the 0.26–0.28 area is likely to meet supply from trapped longs or short sellers.
The daily RSI at about 34.8 confirms this picture. It is weak, yet not deeply oversold, which implies that sellers have been persistent but measured. In other words, the market has not capitulated; it is grinding lower. However, if RSI stabilizes above 30 and starts to curl higher while price holds 0.23, that would signal the first signs of momentum stabilization rather than fresh breakdown risk.
MACD on the daily chart is slightly negative, with the line and signal both near -0.01 and a flat histogram. This tells a subtle but important story: bearish momentum exists, but it is no longer accelerating. Such a configuration often precedes either a sideways consolidation or a slow base. Traders should therefore watch for a modest bullish cross of MACD around the zero area as evidence that the sellers are finally losing control.
Bollinger Bands add another layer. The mid-band near 0.25 sits above current price, while the lower band hugs 0.23, close to the actual close. With the band width relatively tight, the market is experiencing volatility contraction. That environment typically precedes a stronger directional move; the key question is whether that move will break lower from these bands or mean-revert toward the mid-band around 0.25–0.27.
The Average True Range on the daily, near 0.02, points to modest but not explosive swings. Combined with tight Bollinger Bands, it suggests a phase of controlled selling rather than chaotic capitulation. As a result, any sudden volatility expansion away from this low ATR backdrop would be a strong signal that a new phase of the trend is beginning.
Intraday Perspective and XLMUSDT token Momentum
Meanwhile, the intraday structure echoes the daily weakness but also reveals subtle attempts at stabilization. On the hourly chart, price remains around 0.23, below the 20, 50, and 200-period EMAs clustered between 0.24 and 0.25. This alignment keeps the short-term bias negative, yet the flattening of those EMAs hints at early consolidation.
The hourly RSI sits near 26.7, entering oversold territory. This suggests intraday selling is stretched and could invite a short-term relief bounce, especially if price continues to respect the 0.22–0.23 area. MACD is slightly negative but almost flat, mirroring the daily timeframe and underscoring that downside pressure is losing intensity even if a clear bullish reversal has not appeared.
On the 15-minute chart, the picture is even more neutral: RSI around 44 points to balance, price hovers near its 20 and 50 EMAs, and Bollinger Bands are notably tight. As a result, very short-term traders are already trading a range rather than a one-way downtrend, while higher timeframes still lean bearish. This multi-timeframe mix supports the idea of a bearish-to-sideways transition rather than an immediate upside breakout.
Key Levels and Market Reactions
From a level perspective, the daily pivot around 0.24 acts as the first nearby magnet. Trading below it confirms that sellers are still dictating terms, but any sustained recovery above that point would signal improving buyer conviction. Just overhead, the 20-day EMA near 0.26 and the Bollinger mid-band at 0.25–0.26 form a resistance pocket where profit-taking on any rebound is likely.
On the downside, the lower Bollinger Band and the daily S1 pivot both cluster around 0.23, marking an immediate support shelf. A decisive break and close below 0.23 would indicate trend continuation, potentially opening room toward lower, untested areas. Conversely, several daily closes holding 0.23 and pushing back above 0.24 would reinforce the case for a short-term bottoming attempt.
Future Scenarios and Investment Outlook
Overall, the balance of evidence still favors the bears, yet the indicators suggest a market that is tired rather than energized on the downside. For conservative participants, patience may be warranted until price can reclaim the 0.24–0.26 band and until momentum metrics like RSI and MACD show clearer trend reversal confirmation. More aggressive traders might look for tactical longs near 0.23, but only with tight risk controls in case the broader crypto by market cap slide deepens.
If sentiment improves and Bitcoin dominance eases, the environment for altcoin recovery could brighten quickly. Until then, XLM remains in a cautious zone, where disciplined position sizing and respect for support and resistance levels are more important than bold directional bets.
This analysis is for informational purposes only and does not constitute financial advice.
Readers should conduct their own research before making investment decisions.
You May Also Like

Pump.fun CEO to Call Low-Cap Gem to Test New ‘Callouts’ Feature — Is a 100x Incoming?

This U.S. politician’s suspicious stock trade just returned over 200% in weeks
