

Mantle (MNT) Price Prediction 2026, 2027-2030
- Bullish MNT price prediction for 2026 is $1.3698 to $2.2893.
- Mantle (MNT) price might reach $10 soon.
- Bearish MNT price prediction for 2026 is $0.5600.
In this Mantle (MNT) price prediction 2026, 2027-2030, we will analyze the price patterns of MNT by using accurate trader-friendly technical analysis indicators and predict the future movement of the cryptocurrency.
|
TABLE OF CONTENTS
|
|
INTRODUCTION
|
|
|
MANTLE (MNT) PRICE PREDICTION 2026
|
|
| MANTLE (MNT) PRICE PREDICTION 2027, 2028-2030 |
| CONCLUSION |
| FAQ |
Mantle (MNT) Current Market Status
| Current Price | $0.7901 |
| 24 – Hour Price Change | 7.47% Down |
| 24 – Hour Trading Volume | $89.79M |
| Market Cap | $2.57B |
| Circulating Supply | 3.25B MNT |
| All – Time High | $2.85 (On October 09, 2025) |
| All – Time Low | $0.3136 (On October 18, 2023) |
What is Mantle (MNT)
| TICKER | MNT |
| BLOCKCHAIN | Ethereum |
| CATEGORY | Layer 2 Blockchain |
| LAUNCHED ON | 17 July 2023 |
| UTILITIES | Governance, security, gas fees & rewards |
Mantle Network positions itself as a technology stack designed to enhance the scalability of Ethereum, emphasizing EVM (Ethereum Virtual Machine) compatibility. The commitment to EVM compatibility ensures seamless functionality for contracts and tools, requiring minimal adjustments for migration from Ethereum to Mantle Network. This compatibility enables users to explore a diverse range of web3 applications, while developers benefit from an efficient, low-fee environment for deploying smart contracts.
At its foundational level, Mantle Network adopts a modular architecture that integrates an optimistic roll-up protocol with an innovative data availability solution. This unique combination not only inherits the security features of Ethereum but also introduces cost-effectiveness and increased accessibility in terms of data availability. Mantle Network’s approach aims to contribute to the broader blockchain ecosystem by addressing scalability challenges while maintaining compatibility with the established Ethereum infrastructure.
Mantle 24H Technicals
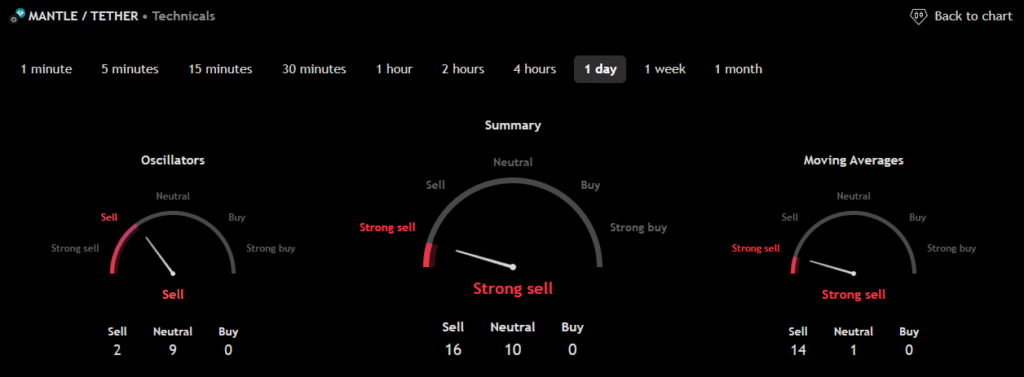 (Source: TradingView)
Mantle (MNT) Price Prediction 2026
Mantle (MNT) ranks 33rd on CoinMarketCap in terms of its market capitalization. The overview of the Mantle price prediction for 2026 is explained below with a daily time frame.
In the above chart, Mantle (MNT) laid out an Ascending Triangle pattern. The ascending triangle is a characteristic pattern of an ongoing bullish trend. This triangle is formed by a horizontal upper trendline that connects the highs, indicating a consistent level of resistance, and a lower trendline that connects the rising lows, reflecting increasing buying pressure.
As the price approaches the apex of the triangle, the tension between buyers and sellers intensifies. If the trend breaks out at the resistance level, the price will continue to move up in this ascending triangle pattern, often leading to further gains. Traders typically look for confirmation of the breakout, which can enhance the likelihood of a successful upward move.
At the time of analysis, the Mantle (MNT) price was $0.7901. If the pattern trend continues, then the price of MNT might reach the resistance levels of $1.1501 and $1.597. If the trend reverses, then the price of MNT may fall to the support level of $0.9536 and $0.8753.
Mantle (MNT) Resistance and Support Levels
The chart given below elucidates the possible resistance and support levels of Mantle (MNT) in 2026.
From the above chart, we can analyze and identify the following as resistance and support levels of Mantle (MNT) for 2026.
| Resistance Level 1 | $1.3698 |
| Resistance Level 2 | $2.2893 |
| Support Level 1 | $0.8715 |
| Support Level 2 | $0.5600 |
MNT Resistance & Support Levels
Mantle (MNT) Price Prediction 2026 — RVOL, MA, and RSI
The technical analysis indicators such as Relative Volume (RVOL), Moving Average (MA), and Relative Strength Index (RSI) of Mantle (MNT) are shown in the chart below.
From the readings on the chart above, we can make the following inferences regarding the current Mantle (MNT) market in 2026.
| INDICATOR | PURPOSE | READING | INFERENCE |
| 50-Day Moving Average (50MA) | Nature of the current trend by comparing the average price over 50 days | 50 MA = $1.2903Price = $1.0829 (50MA > Price) |
Bearish/Downtrend |
| Relative Strength Index (RSI) | Magnitude of price change;Analyzing oversold & overbought conditions | 46.0787 <30 = Oversold 50-70 = Neutral>70 = Overbought |
Nearly Oversold |
| Relative Volume (RVOL) | Asset’s trading volume in relation to its recent average volumes | Below cutoff line | Weak Volume |
Mantle (MNT) Price Prediction 2026 — ADX, RVI
In the below chart, we analyze the strength and volatility of Mantle (MNT) using the following technical analysis indicators — Average Directional Index (ADX) and Relative Volatility Index (RVI).
From the readings on the chart above, we can make the following inferences regarding the price momentum of Mantle (MNT).
| INDICATOR | PURPOSE | READING | INFERENCE |
| Average Directional Index (ADX) | Strength of the trend momentum | 27.8283 | Strong Trend |
| Relative Volatility Index (RVI) | Volatility over a specific period | 58.07 <50 = Low >50 = High |
High Volatility |
Comparison of MNT with BTC, ETH
Let us now compare the price movements of Mantle (MNT) with that of Bitcoin (BTC), and Ethereum (ETH).
From the above chart, we can interpret that the price action of MNT is similar to that of BTC and ETH. That is, when the price of BTC and ETH increases or decreases, the price of MNT also increases or decreases, respectively.
Mantle (MNT) Price Prediction 2027, 2028 – 2030
With the help of the aforementioned technical analysis indicators and trend patterns, let us predict the price of Mantle (MNT) between 2027, 2028, 2029, and 2030.
| Year | Bullish Price | Bearish Price |
| Mantle (MNT) Price Prediction 2027 | $15 | $0.4 |
| Mantle (MNT) Price Prediction 2028 | $18 | $0.3 |
| Mantle (MNT) Price Prediction 2029 | $26 | $0.2 |
| Mantle (MNT) Price Prediction 2030 | $30 | $0.1 |
Conclusion
If Mantle (MNT) establishes itself as a good investment in 2026, this year would be favorable to cryptocurrency. In conclusion, the bullish Mantle (MNT) price prediction for 2026 is $2.2893. Comparatively, if unfavorable sentiment is triggered, the bearish Mantle (MNT) price prediction for 2026 is $0.5600.
If the market momentum and investors’ sentiment positively elevate, then Mantle (MNT) might hit $10. Furthermore, with future upgrades and advancements in the Mantle ecosystem, MNT might surpass its current all-time high (ATH) of $2.85 and mark its new ATH.
FAQ
1. What is Mantle (MNT)?
Mantle Network positions itself as a technology stack designed to enhance the scalability of Ethereum, emphasizing EVM (Ethereum Virtual Machine) compatibility.
2. Where can you buy a Mantle (MNT)?
Traders can trade Mantle (MNT) on the following cryptocurrency exchanges such as Bybit, MEXC, BingX, Huobi, Gate, Coinone and Korbit
3. Will Mantle (MNT) record a new ATH soon?
With the ongoing developments and upgrades within the Mantle platform, Mantle (MNT) has a high possibility of reaching its ATH soon.
4. What is the current all-time high (ATH) of Mantle (MNT)?
Mantle (MNT) hit its current all-time high (ATH) of $2.85 on October 09, 2025.
5. What is the lowest price of Mantle (MNT)?
According to CoinMarketCap, MNT hit its all-time low (ATL) of $0.3136 on Oct 18, 2023.
6. Will Mantle (MNT) hit $10?
If Mantle (MNT) becomes one of the active cryptocurrencies that majorly maintain a bullish trend, it might rally to hit $10 soon.
7. What will be the Mantle (MNT) price by 2027?
Mantle (MNT) price might reach $15 by 2027.
8. What will be the Mantle (MNT) price by 2028?
Mantle (MNT) price might reach $18 by 2028.
9. What will be the Mantle (MNT) price by 2029?
Mantle (MNT) price might reach $26 by 2029.
10. What will be the Mantle (MNT) price by 2030?
Mantle (MNT) price might reach $30 by 2030.
Top Crypto Predictions
Solana (SOL) Price Prediction
Litecoin (LTC) Price Prediction
Optimism (OP) Price Prediction
Disclaimer: The opinion expressed in this article is solely the author’s. It does not represent any investment advice. TheNewsCrypto team encourages all to do their own research before investing.


You May Also Like

Gold declines to near $4,500 as renewed US‑Iran tensions, Fed tightening bets weigh

Ripple’s latest trademark filings signal a deeper push into Wall Street

Analyzing the Spot CVD Chart for BTC/USDT: A Trader’s Guide for May 27


