

Shiba Inu (SHIB) Price Prediction 2026, 2027-2030
- Bullish SHIB price prediction for 2026 is $0.00001035 to $0.00001447.
- Shiba Inu (SHIB) price might reach $0.0001 soon.
- Bearish SHIB price prediction for 2026 is $0.00000548.
In this Shiba Inu (SHIB) price prediction for 2026, 2027-2030, we will analyze the price patterns of SHIB by using accurate trader-friendly technical analysis indicators and predict the future movement of the cryptocurrency.
|
TABLE OF CONTENTS
|
|
INTRODUCTION
|
|
|
SHIBA INU (SHIB) PRICE PREDICTION 2026
|
|
| SHIBA INU (SHIB) PRICE PREDICTION 2027, 2028-2030 |
| CONCLUSION |
| FAQ |
Shiba Inu (SHIB) Current Market Status
| Current Price | $0.000008594 |
| 24 – Hour Price Change | 0.4% Down |
| 24 – Hour Trading Volume | $104.47M |
| Market Cap | $5.06B |
| Circulating Supply | 589.24T SHIB |
| All Time High | $0.00008845 (On Oct 28, 2021) |
| All – Time Low | $0.00000000008165 (On Sep 01, 2020) |
What is Shiba Inu (SHIB)
| TICKER | SHIB |
| BLOCKCHAIN | Ethereum |
| CATEGORY | Decentralized cryptocurrency |
| LAUNCHED ON | August 2020 |
| UTILITIES | Governance, Fast Transactions, gas fees & rewards |
Shiba Inu (SHIB) was launched on the Ethereum blockchain and also resides on the Binance Smart Chain (BSC). This popular memecoin was developed and launched in 2020 by a pseudonymous founder Ryoshi. Shiba Inu exists as a potential contender to the largest memecoin, Dogecoin (DOGE).
The Shiba Inu ecosystem will likely launch its layer-2 blockchain called Shibarium by 2023. In March 2023, Shibarium Beta – named Puppynet – was launched. Alongside SHIB, Bone ShibaSwap (BONE) and Doge Killer (LEASH) are other tokens of the Shiba Inu ecosystem.
Shiba Inu 24H Technicals
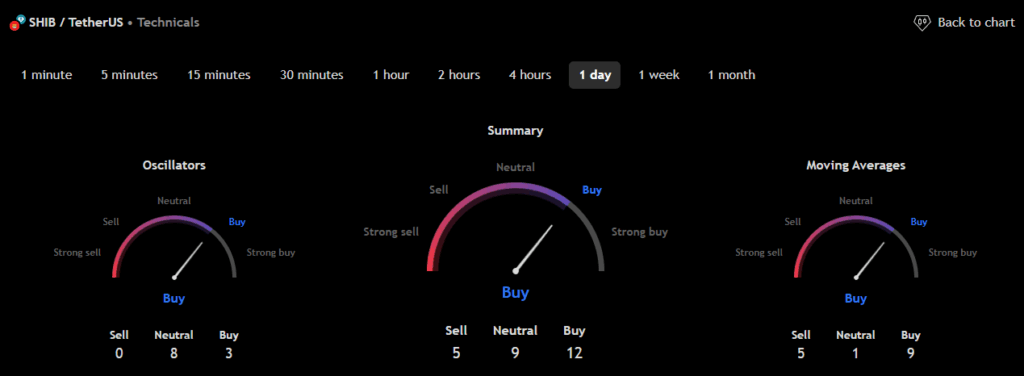 (Source: TradingView)
Shiba Inu (SHIB) Price Prediction 2026
Shiba Inu (SHIB) ranks 24th on CoinMarketCap in terms of its market capitalization. The overview of the Shiba Inu price prediction for 2026 is explained below with a daily time frame.
In the above chart, Shiba Inu (SHIB) laid out a Right Angle Descending Broadening Wedge pattern. A right-angled descending broadening wedge is a bullish reversal pattern. The pattern is an inverted ascending triangle because it is made up of two converging lines with a horizontal line for the resistance and a bearish downward slant for the support.
At the time of analysis, the price of Shiba Inu (SHIB) was recorded at $0.000008594. If the pattern trend continues, then the price of SHIB might reach the resistance levels of $0.00001044 and $0.00001596. If the trend reverses, then the price of SHIB may fall to the support level of $0.00000832 and $0.00000698.
Shiba Inu (SHIB) Resistance and Support Levels
The chart given below elucidates the possible resistance and support levels of Shiba Inu (SHIB) in 2026.
From the above chart, we can analyze and identify the following as resistance and support levels of Shiba Inu (SHIB) for 2026.
| Resistance Level 1 | $0.00001035 |
| Resistance Level 2 | $0.00001447 |
| Support Level 1 | $0.00000741 |
| Support Level 2 | $0.00000548 |
SHIB Resistance & Support Levels
Shiba Inu (SHIB) Price Prediction 2026 — RVOL, MA, and RSI
The technical analysis indicators such as Relative Volume (RVOL), Moving Average (MA), and Relative Strength Index (RSI) of Shiba Inu (SHIB) are shown in the chart below.
From the readings on the chart above, we can make the following inferences regarding the current Shiba Inu (SHIB) market in 2026.
| INDICATOR | PURPOSE | READING | INFERENCE |
| 50-Day Moving Average (50MA) | Nature of the current trend by comparing the average price over 50 days | 50 MA = $0.00000814Price = $0.00000855 (50MA < Price) |
Bearish/Downtrend |
| Relative Strength Index (RSI) | Magnitude of price change;Analyzing oversold & overbought conditions | 56.89103721 <30 = Oversold 50-70 = Neutral>70 = Overbought |
Neutral |
| Relative Volume (RVOL) | Asset’s trading volume in relation to its recent average volumes | Below cutoff line | Weak volume |
Shiba Inu (SHIB) Price Prediction 2026 — ADX, RVI
In the below chart, we analyze the strength and volatility of Shiba Inu (SHIB) using the following technical analysis indicators — Average Directional Index (ADX) and Relative Volatility Index (RVI).
From the readings on the chart above, we can make the following inferences regarding the price momentum of Shiba Inu (SHIB).
| INDICATOR | PURPOSE | READING | INFERENCE |
| Average Directional Index (ADX) | Strength of the trend momentum | 34.45675510 | Strong Trend |
| Relative Volatility Index (RVI) | Volatility over a specific period | 25.15 <50 = Low >50 = High |
Low Volatility |
Comparison of SHIB with BTC, ETH
Let us now compare the price movements of Shiba Inu (SHIB) with that of Bitcoin (BTC), and Ethereum (ETH).
From the above chart, we can interpret that the price action of SHIB is similar to that of BTC and ETH. That is, when the price of BTC and ETH increases or decreases, the price of SHIB also increases or decreases respectively.
Shiba Inu (SHIB) Price Prediction 2027, 2028 – 2030
With the help of the aforementioned technical analysis indicators and trend patterns, let us predict the price of Shiba Inu (SHIB) between 2027, 2028, 2029, and 2030.
| Year | Bullish Price | Bearish Price |
| Shiba Inu (SHIB) Price Prediction 2027 | $0.0004 | $0.000005 |
| Shiba Inu (SHIB) Price Prediction 2028 | $0.0008 | $0.000004 |
| Shiba Inu (SHIB) Price Prediction 2029 | $0.001 | $0.000003 |
| Shiba Inu (SHIB) Price Prediction 2030 | $0.005 | $0.000002 |
Conclusion
If Shiba Inu (SHIB) establishes itself as a good investment in 2026, this year would be favorable to the cryptocurrency. In conclusion, the bullish Shiba Inu (SHIB) price prediction for 2026 is $0.00001447. Comparatively, if unfavorable sentiment is triggered, the bearish Shiba Inu (SHIB) price prediction for 2026 is $0.00000548.
If the market momentum and investors’ sentiment positively elevates, then Shiba Inu (SHIB) might hit $0.0001. Furthermore, with future upgrades and advancements in the Shiba Inu ecosystem, SHIB might surpass its current all-time high (ATH) of $0.00008845, and mark its new ATH.
FAQ
1. What is Shiba Inu (SHIB)?
Shiba Inu (SHIB) is a popular memecoin that was launched in 2020 as an ERC-20 token. It is compatible with both the Ethereum blockchain and Binance Smart Chain (BSC).
2. Where can you purchase Shiba Inu (SHIB)?
Shiba Inu (SHIB) has been listed on many crypto exchanges which include Binance, Bybit, OKX, UZX, and Bitget.
3. Will Shiba Inu (SHIB) reach a new ATH soon?
With the ongoing developments and upgrades within the Shiba Inu Platform, SHIB has a high possibility of reaching its ATH soon.
4. What is the current all-time high (ATH) of Shiba Inu (SHIB)?
On Oct 28, 2021, Shiba Inu (SHIB) reached its new all-time high (ATH) of $0.00008845.
5. What is the lowest price of Shiba Inu (SHIB)?
According to CoinMarketCap, SHIB hit its all-time low (ATL) of $0.00000000008165, On Sep 01, 2020.
6. Will Shiba Inu (SHIB) reach $0.0001?
If Shiba Inu (SHIB) becomes one of the active cryptocurrencies that majorly maintain a bullish trend, it might rally to hit $0.0001 soon.
7. What will be Shiba Inu (SHIB) price by 2027?
Shiba Inu (SHIB) price is expected to reach $0.0004 by 2027.
8. What will be Shiba Inu (SHIB) price by 2028?
Shiba Inu (SHIB) price is expected to reach $0.0008 by 2028.
9. What will be Shiba Inu (SHIB) price by 2029?
Shiba Inu (SHIB) price is expected to reach $0.001 by 2029.
10. What will be Shiba Inu (SHIB) price by 2030?
Shiba Inu (SHIB) price is expected to reach $0.005 by 2030.
Top Crypto Predictions
Hyperliquid (HYPE) Price Prediction
Cardano (ADA) Price Prediction
Pi (PI) Price Prediction
Disclaimer: The opinion expressed in this article is solely the author’s. It does not represent any investment advice. TheNewsCrypto team encourages all to do their own research before investing.


You May Also Like

Stunning 96% Surge And 50% Plunge Define Volatile Market Session

Come Back To Me’ To Air At BIFF Before Global Release


