

Bitcoin Downtrend Driven by Early Whale Selling, Says Ki Young Ju
Bitcoin’s sharp correction from $110,000 to around $80,000 is linked to heavy selling by early whales with cost bases near $16,000. CryptoQuant CEO Ki Young Ju notes that on-chain metrics indicate Bitcoin is now in the “shoulder” phase of its cycle, suggesting limited short-term upside potential.
This selling is overwhelming institutional demand from ETFs and MicroStrategy, shaping the cryptocurrency’s 2025 outlook. In an interview with Upbit’s Upbitcare, Ju provides a data-driven look at the shifting landscape for Bitcoin investors and the forces affecting its current market structure.
Early Bitcoin Whales Fuel Selling Pressure
Ki Young Ju explains that today’s market is shaped by a contest between two main whale groups. Legacy whales, holding Bitcoin with an average cost basis near $16,000, have begun to realize hefty profits, selling at a rate measured in hundreds of millions of USD each day. This persistent selling has exerted intense downward pressure on Bitcoin’s price.
At the same time, institutional whales via spot Bitcoin ETFs and MicroStrategy have accumulated significant positions. Yet, their buying power has not matched the scale of early whales’ sell-offs. According to Ju, wallets holding over 10,000 BTC for more than 155 days typically have an average cost basis of around $38,000. Binance traders entered positions around $50,000, so many market participants are in profit and can sell if needed.
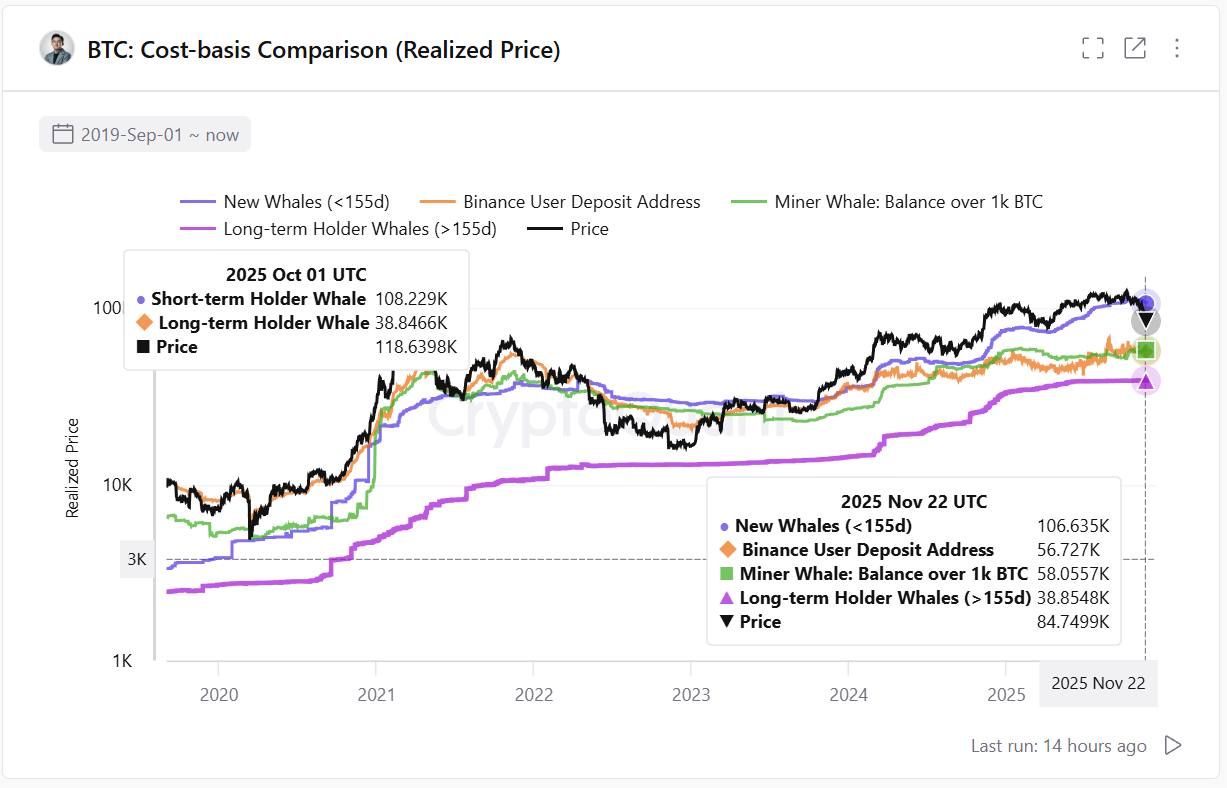 Cost basis comparison across different Bitcoin holder categories. Source: CryptoQuant
The CryptoQuant CEO points out that spot ETF and MicroStrategy inflows had boosted the market earlier in 2025. However, those flows have now declined. Outflows have started to dominate the market landscape. For example, data from Farside Investors showed Bitcoin ETFs recorded $42.8 million in net inflows on November 26, 2025, lifting cumulative inflows to $62.68 billion. Despite these figures, the sustained selling from early whales outweighs institutional accumulation.
Market Cycle Analysis Signals Limited Upside
On-chain profit-and-loss metrics offer crucial insights into market cycles. Ju’s analysis using the PnL index with a 365-day moving average reveals that the market has entered a “shoulder” phase. This late-cycle status indicates constrained growth potential and increased risk of a correction.
The valuation multiplier reflects a neutral-to-flat outlook. In previous cycles, each new dollar drove amplified market-cap growth. Now, that multiplier effect has faded. This suggests market leverage is less efficient, and the structure does not support significant gains.
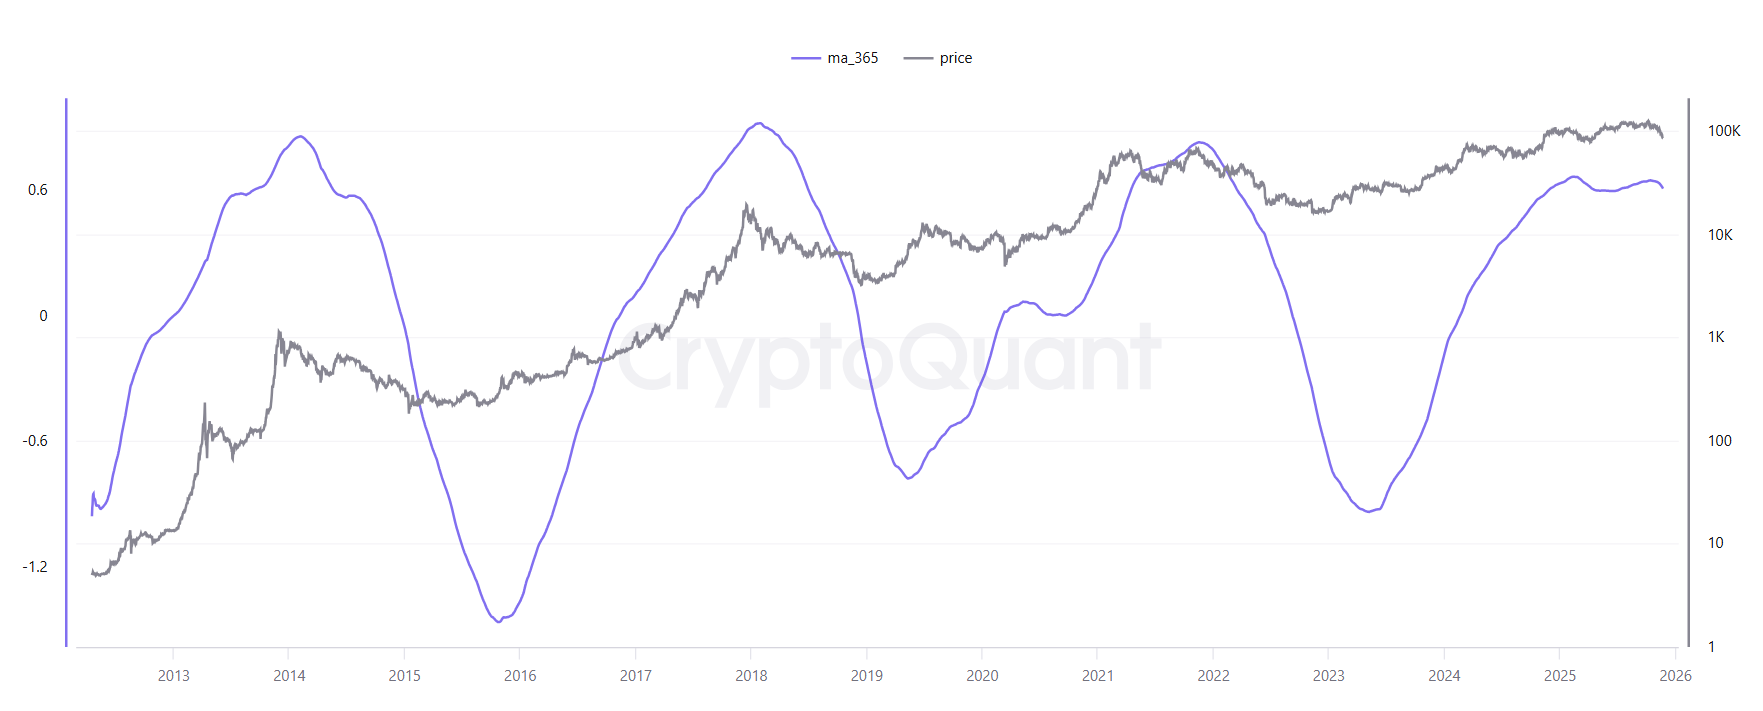 PnL index showing Bitcoin’s current cycle position. Source: CryptoQuant
Ju does not expect a dramatic 70-80% crash. Still, he considers corrections up to 30% reasonable. A drop from $100,000 could mean Bitcoin falling to about $70,000. He uses data from OKX futures long-short ratios, exchange leverage ratios, and buy-sell flow patterns to support this view.
Ju underscores the importance of a data-driven approach. In a recent post, he urged traders to use metrics for conviction, not speculation. His focus remains on interpreting on-chain data, exchange activity, and market structure.
This comprehensive analysis provides a grounded assessment based on on-chain evidence. As early Bitcoin whales continue to sell at profits, institutions face a harsh climate. With high leverage ratios, neutral valuation multipliers, and a late-cycle stance, the market has limited potential for a major rally in the near future.
You May Also Like

XRP Price Prediction: XRP Trapped At $1.37 As Breakout Setup Tightens

Why Digital Banks Are Growing 3x Faster Than Traditional Banks

