The Bitcoin price surged 4% in the past 24 hours to trade at $91,393 as of 2:41 a.m. EST on trading volume that rose 14% [...]The Bitcoin price surged 4% in the past 24 hours to trade at $91,393 as of 2:41 a.m. EST on trading volume that rose 14% [...]

Bitcoin Price Back Above $91K On December Rate Cut Hopes As SpaceX Moves $105M In BTC

2025/11/27 20:04
3 min read
For feedback or concerns regarding this content, please contact us at crypto.news@mexc.com

The Bitcoin price surged 4% in the past 24 hours to trade at $91,393 as of 2:41 a.m. EST on trading volume that rose 14% to $75.7 billion.

BTC rebounded over the last day, climbing above $91,000 as rising expectations of a US Federal Reserve rate cut drove a wave of renewed investor interest.

Markets now price in roughly an 85% chance of a quarter-point reduction in December, a sharp jump from a measly 44% chance a week ago, according to data from CME FedWatch.

If a rate cut occurs, lower rates could lift “risk assets” such as Bitcoin by increasing liquidity and boosting appetite for higher-yielding assets.

Meanwhile, as the largest crypto by market capitalization recovered, a crypto wallet associated with SpaceX moved 1,163 BTC valued at around $105 million to a new wallet, according to Arkham Intelligence data.

However, it remains unclear whether SpaceX moved the coins for custody purposes or with the intent to sell them.

Bitcoin finally broke out of a fragile $81,000-$89,000 zone, a zone that highlighted the market’s lack of liquidity and demand.

Can the recovery be sustained and Bitcoin’s price rise even higher?

Bitcoin Price Poised For A Sustained Recovery

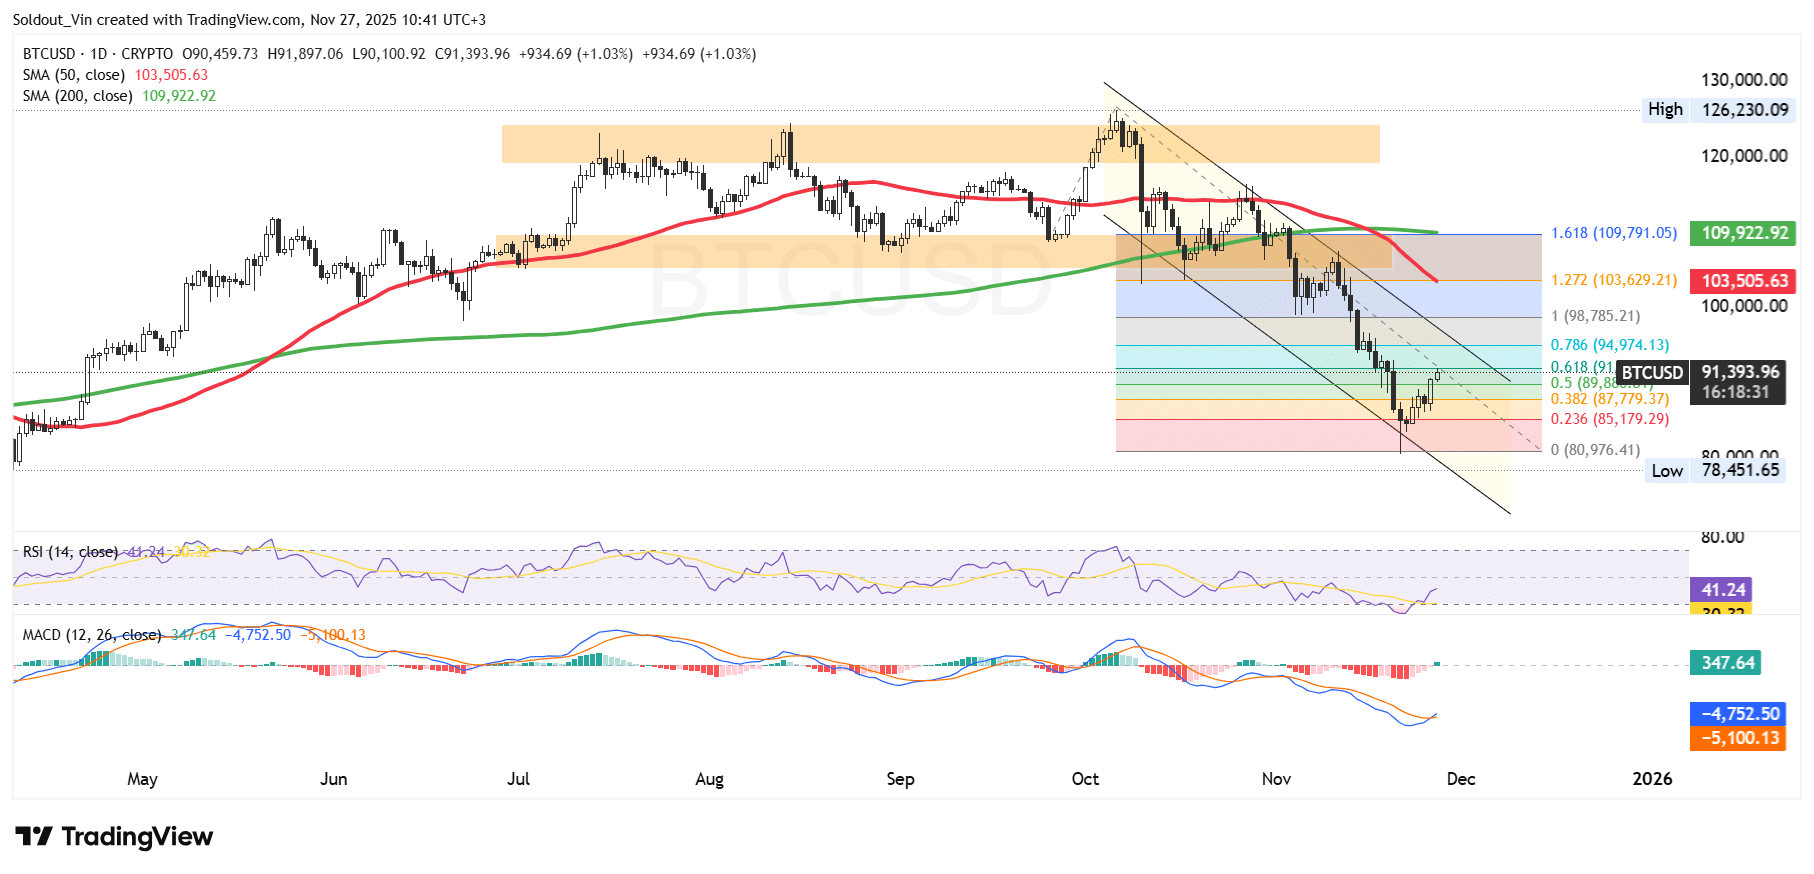
After a sustained surge from May, the BTC price was rejected above the $123,000 zone, forcing it to trade sideways between this level and the $107,400 support.

However, the Bitcoin price could not hold that level, leading the bears to push the crypto into a well-defined falling channel, with BTC crossing key Fibonacci support levels. BTC is now surging toward the 0.5 Fibonacci ($89,880) and the 0.618 Fibonacci ($91,982) levels.

The sustained bearish trend has pushed BTC’s price below both the 50-day and 200-day Simple Moving Averages (SMAs), suggesting the bearish trend remains in place.

Meanwhile, on the daily chart, the Relative Strength Index (RSI) is recovering from oversold territory, currently at 41, suggesting buyers are taking back control.

The Moving Average Convergence Divergence (MACD) also supports the recovery attempt, as the blue MACD line has crossed above the orange signal line. With green bars now forming on the histogram, BTC is currently riding positive momentum.

Bitcoin Price Chart Analysis Source: TradingViewBTC/USD Price Analysis Source: TradingView

BTC Price Prediction

According to the BTC/USD chart analysis, the Bitcoin price is attempting a short-term rebound after touching the lower Fibonacci zone near the 0.236–0.382 levels, which often act as reaction points during corrective phases.

If momentum continues to improve, the next key resistance for BTC lies around the 0.5 and 0.618 Fibonacci retracements at $89,800–$91,800, where sellers are likely to re-enter.

A successful breakout from the descending channel could open the path toward the $95,000–$98,500 zone, which falls within the 0.786 Fib level and a prior consolidation region.

However, if the Bitcoin price fails to hold above recent lows, a retest of the $80,000–$82,000 support range becomes possible, as it aligns with the Fib bottom and previous liquidity levels. 

Related News:

Market Opportunity
Bitcoin Logo
Bitcoin Price(BTC)
$71 053,31
$71 053,31$71 053,31
+1,32%
USD
Bitcoin (BTC) Live Price Chart
Disclaimer: The articles reposted on this site are sourced from public platforms and are provided for informational purposes only. They do not necessarily reflect the views of MEXC. All rights remain with the original authors. If you believe any content infringes on third-party rights, please contact crypto.news@mexc.com for removal. MEXC makes no guarantees regarding the accuracy, completeness, or timeliness of the content and is not responsible for any actions taken based on the information provided. The content does not constitute financial, legal, or other professional advice, nor should it be considered a recommendation or endorsement by MEXC.

You May Also Like

XRP Price Prediction: XRP Trapped At $1.37 As Breakout Setup Tightens

XRP Price Prediction: XRP Trapped At $1.37 As Breakout Setup Tightens

The post XRP Price Prediction: XRP Trapped At $1.37 As Breakout Setup Tightens appeared on BitcoinEthereumNews.com. XRP trades at $1.3771, down 0.53%, pressing
Share
BitcoinEthereumNews2026/03/24 01:08
Why Digital Banks Are Growing 3x Faster Than Traditional Banks

Why Digital Banks Are Growing 3x Faster Than Traditional Banks

The Growth Gap Between Digital and Traditional Banking Digital banks are acquiring customers at approximately three times the rate of their traditional counterparts
Share
Techbullion2026/03/24 00:50
Analyst Predicts ‘Uptober’ Rally for BTC Regardless of FOMC Decision

Analyst Predicts ‘Uptober’ Rally for BTC Regardless of FOMC Decision

The post Analyst Predicts ‘Uptober’ Rally for BTC Regardless of FOMC Decision appeared on BitcoinEthereumNews.com. Bitcoin traded at $116,236 as of 14:04 UTC on Sept. 17, up about 1% in the past 24 hours, holding above a key level as markets await the Federal Reserve’s policy announcement. Analysts’ comments Dean Crypto Trades noted on X that bitcoin is only about 7% above its post-election local peak, while the S&P 500 has risen 9% and gold has surged 36% during the same period. He said bitcoin has compressed more than those assets, making it likely to lead the next larger move, though it could form a “lower high” before extending further. He added that ether could join in once it breaks $5,000 and enters price discovery. Lark Davis pointed to bitcoin’s history around September FOMC meetings, saying every September decision since 2020 — except during the 2022 bear market — has preceded a strong rally. He stressed that the pattern is less about the Fed’s rate choice itself and more about seasonal dynamics, arguing that bitcoin tends to thrive in this period heading into “Uptober.” CoinDesk Research’s technical analysis According to CoinDesk Research’s technical analysis data model, bitcoin rose about 0.9% during the Sept. 16–17 analysis window, climbing from $115,461 to $116,520. BTC reached a session high of $117,317 at 07:00 UTC on Sept. 17 before consolidating. Following that peak, bitcoin tested the $116,400–$116,600 range multiple times, confirming it as a short-term support zone. In the final hour of the session, between 11:39 and 12:38 UTC, BTC attempted a breakout: prices moved narrowly between $116,351 and $116,376 before spiking to $116,551 at 12:34 on higher volume. This confirmed a consolidation-breakout pattern, though the gains were modest. Overall, bitcoin remains firm above $116,000, with support around $116,400 and resistance near $117,300. Latest 24-hour and one-month chart analysis The latest 24-hour CoinDesk Data chart, ending 14:04 UTC on…
Share
BitcoinEthereumNews2025/09/18 12:42