Pi Coin price continued its recent recovery, rising by over 5.8% on Thursday, and reaching its highest level since Oct. 27.Pi Coin price continued its recent recovery, rising by over 5.8% on Thursday, and reaching its highest level since Oct. 27.

These catalysts may trigger a Pi Coin price surge

2025/11/28 04:00
3 min read
For feedback or concerns regarding this content, please contact us at crypto.news@mexc.com

Pi Coin price continued its recent recovery, rising by over 5.8% on Thursday, and reaching its highest level since Oct. 27. 

Summary
  • Pi Network price could be on the verge of a strong bullish breakout.
  • The developers have invested in CiDi Games and OpenMind.
  • Technicals suggest that a rebound could start soon.

Pi Network (PI) rose to $0.2700, up by nearly 70% from its lowest point this year. Its rebound has seen it beat other top altcoins such as Ethereum (ETH) and Solana (SOL) in the past few weeks.

Potential catalysts for the Pi Coin price

Pi Coin has several bullish catalysts that could push it to the psychological $0.50 level in the coming months. The first one is that the team is working to boost the ecosystem. In a statement on Thursday, they announced an investment in CiDi Games, a company building games that will expand Pi’s use case.

This investment came weeks after the team invested in OpenMind, a company in the AI industry. This investment will likely create value for node operators by allowing them to offer services to OpenMind. In future, they will be able to do the same for other companies in the AI industry.

Second, Pi Network price will likely benefit once it completes the migration from Protocol 19 to Protocol 23 of the Stellar Network. This upgrade will improve smart contract efficiency and boost the scalability of the network. 

Third, there is a chance that Pi will receive MiCA approval in Europe, which would see it become a more mainstream token. One reason this may happen is that the developers have invested in verifying all tokens that move to the mainnet. 

Most importantly, Pi is one of the few top-50 coins that have yet to be listed on mainstream exchanges like Upbit and Binance. Chances are, this listing will happen as the ecosystem grows, pushing it higher.

These potential catalysts likely explain why one top whale continues to accumulate Pi. This whale has accumulated millions of tokens worth over $91 million so far, and this buying spree may continue.

Pi Network price technicals points to more upside

These catalysts may trigger a Pi Coin price surge - 1

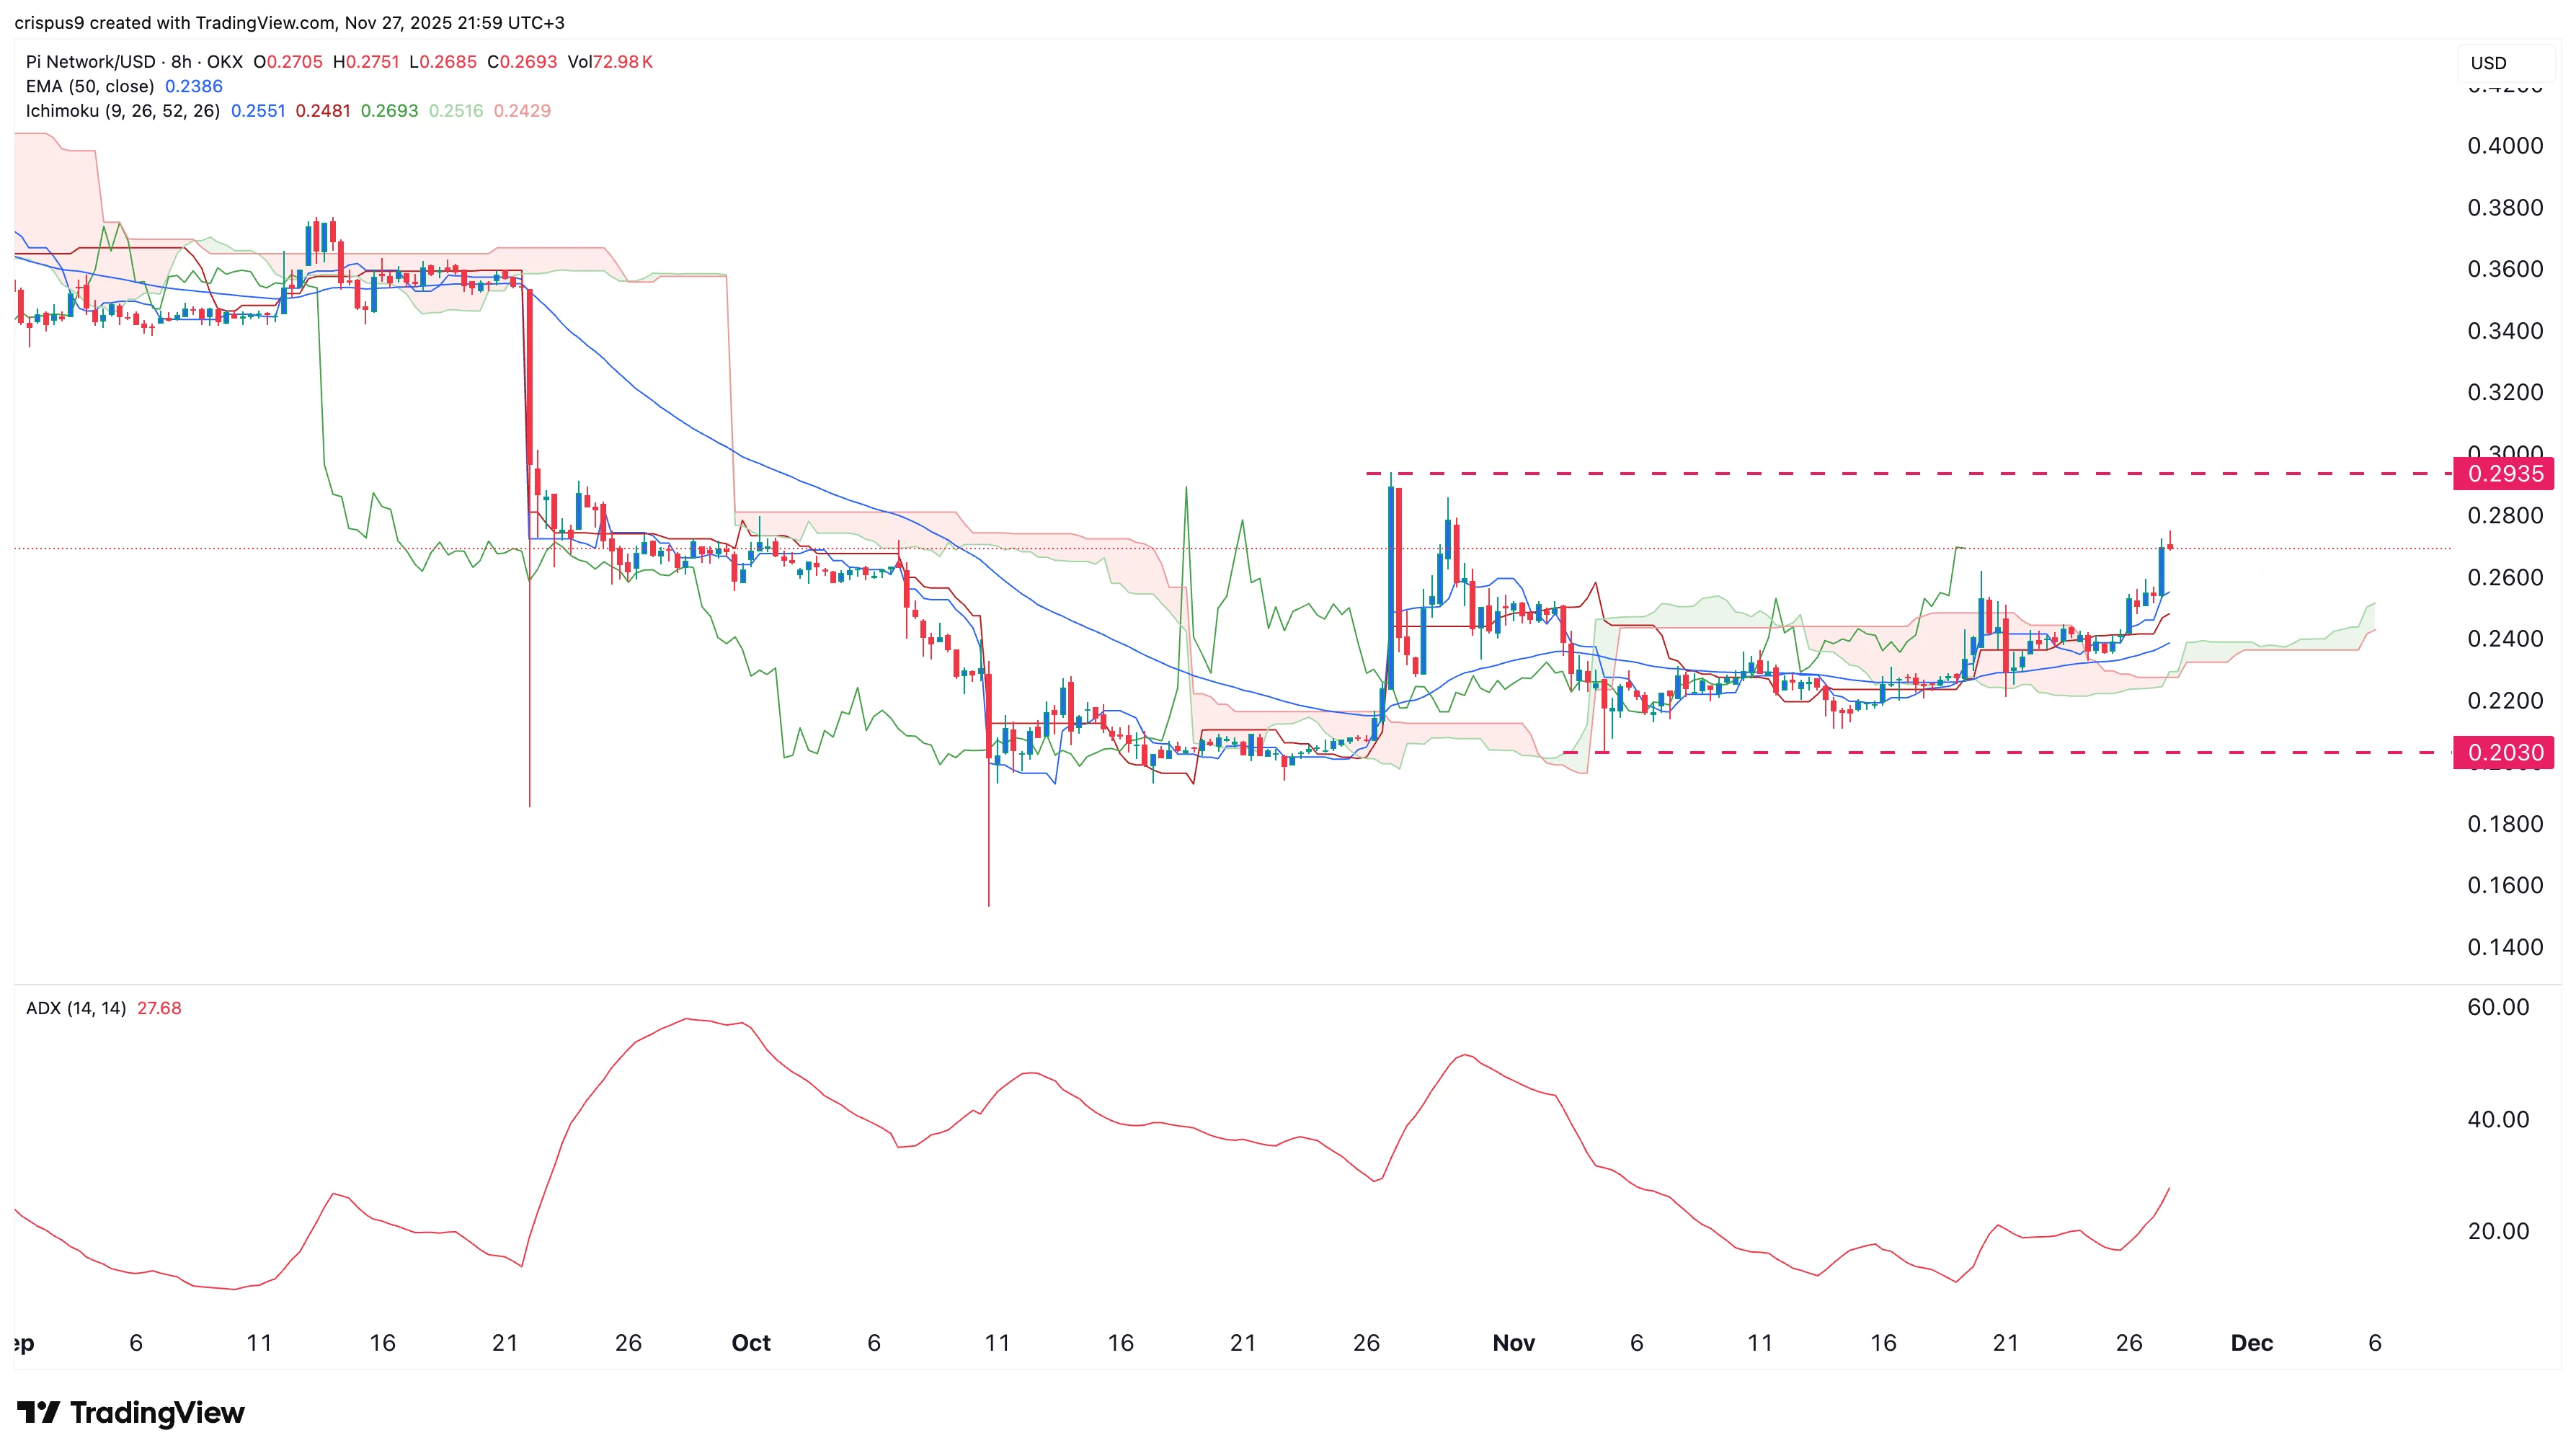
The eight-hour chart shows that the value of Pi has continued to rise over the past few days. This recovery started when the token bottomed at $0.2030 on November 4. 

The Average Directional Index has risen to 27 and remains pointing upwards, a sign that strength is continuing. At the same time, it remains slightly above the 50-period moving average and the Ichimoku cloud.

Therefore, the token now needs to move above the important resistance at $0.2935, its October high. Flipping that level into support will bring the $0.50 resistance into view.

Market Opportunity
Pi Network Logo
Pi Network Price(PI)
$0.19073
$0.19073$0.19073
+0.60%
USD
Pi Network (PI) Live Price Chart
Disclaimer: The articles reposted on this site are sourced from public platforms and are provided for informational purposes only. They do not necessarily reflect the views of MEXC. All rights remain with the original authors. If you believe any content infringes on third-party rights, please contact crypto.news@mexc.com for removal. MEXC makes no guarantees regarding the accuracy, completeness, or timeliness of the content and is not responsible for any actions taken based on the information provided. The content does not constitute financial, legal, or other professional advice, nor should it be considered a recommendation or endorsement by MEXC.

You May Also Like

XRP Price Prediction: XRP Trapped At $1.37 As Breakout Setup Tightens

XRP Price Prediction: XRP Trapped At $1.37 As Breakout Setup Tightens

The post XRP Price Prediction: XRP Trapped At $1.37 As Breakout Setup Tightens appeared on BitcoinEthereumNews.com. XRP trades at $1.3771, down 0.53%, pressing
Share
BitcoinEthereumNews2026/03/24 01:08
Why Digital Banks Are Growing 3x Faster Than Traditional Banks

Why Digital Banks Are Growing 3x Faster Than Traditional Banks

The Growth Gap Between Digital and Traditional Banking Digital banks are acquiring customers at approximately three times the rate of their traditional counterparts
Share
Techbullion2026/03/24 00:50
Analyst Predicts ‘Uptober’ Rally for BTC Regardless of FOMC Decision

Analyst Predicts ‘Uptober’ Rally for BTC Regardless of FOMC Decision

The post Analyst Predicts ‘Uptober’ Rally for BTC Regardless of FOMC Decision appeared on BitcoinEthereumNews.com. Bitcoin traded at $116,236 as of 14:04 UTC on Sept. 17, up about 1% in the past 24 hours, holding above a key level as markets await the Federal Reserve’s policy announcement. Analysts’ comments Dean Crypto Trades noted on X that bitcoin is only about 7% above its post-election local peak, while the S&P 500 has risen 9% and gold has surged 36% during the same period. He said bitcoin has compressed more than those assets, making it likely to lead the next larger move, though it could form a “lower high” before extending further. He added that ether could join in once it breaks $5,000 and enters price discovery. Lark Davis pointed to bitcoin’s history around September FOMC meetings, saying every September decision since 2020 — except during the 2022 bear market — has preceded a strong rally. He stressed that the pattern is less about the Fed’s rate choice itself and more about seasonal dynamics, arguing that bitcoin tends to thrive in this period heading into “Uptober.” CoinDesk Research’s technical analysis According to CoinDesk Research’s technical analysis data model, bitcoin rose about 0.9% during the Sept. 16–17 analysis window, climbing from $115,461 to $116,520. BTC reached a session high of $117,317 at 07:00 UTC on Sept. 17 before consolidating. Following that peak, bitcoin tested the $116,400–$116,600 range multiple times, confirming it as a short-term support zone. In the final hour of the session, between 11:39 and 12:38 UTC, BTC attempted a breakout: prices moved narrowly between $116,351 and $116,376 before spiking to $116,551 at 12:34 on higher volume. This confirmed a consolidation-breakout pattern, though the gains were modest. Overall, bitcoin remains firm above $116,000, with support around $116,400 and resistance near $117,300. Latest 24-hour and one-month chart analysis The latest 24-hour CoinDesk Data chart, ending 14:04 UTC on…
Share
BitcoinEthereumNews2025/09/18 12:42