

Dogecoin price outlook: can DOGE stabilize after the latest selloff?

 The recent Dogecoin price action against USDT shows a market trying to stabilize after a notable pullback. With the token hovering around the mid‑teens, traders are asking whether this is a pause before another leg lower or the early stage of a base that could later support a recovery. In this piece, we unpack the current technical landscape and outline what it might mean for the next moves.
 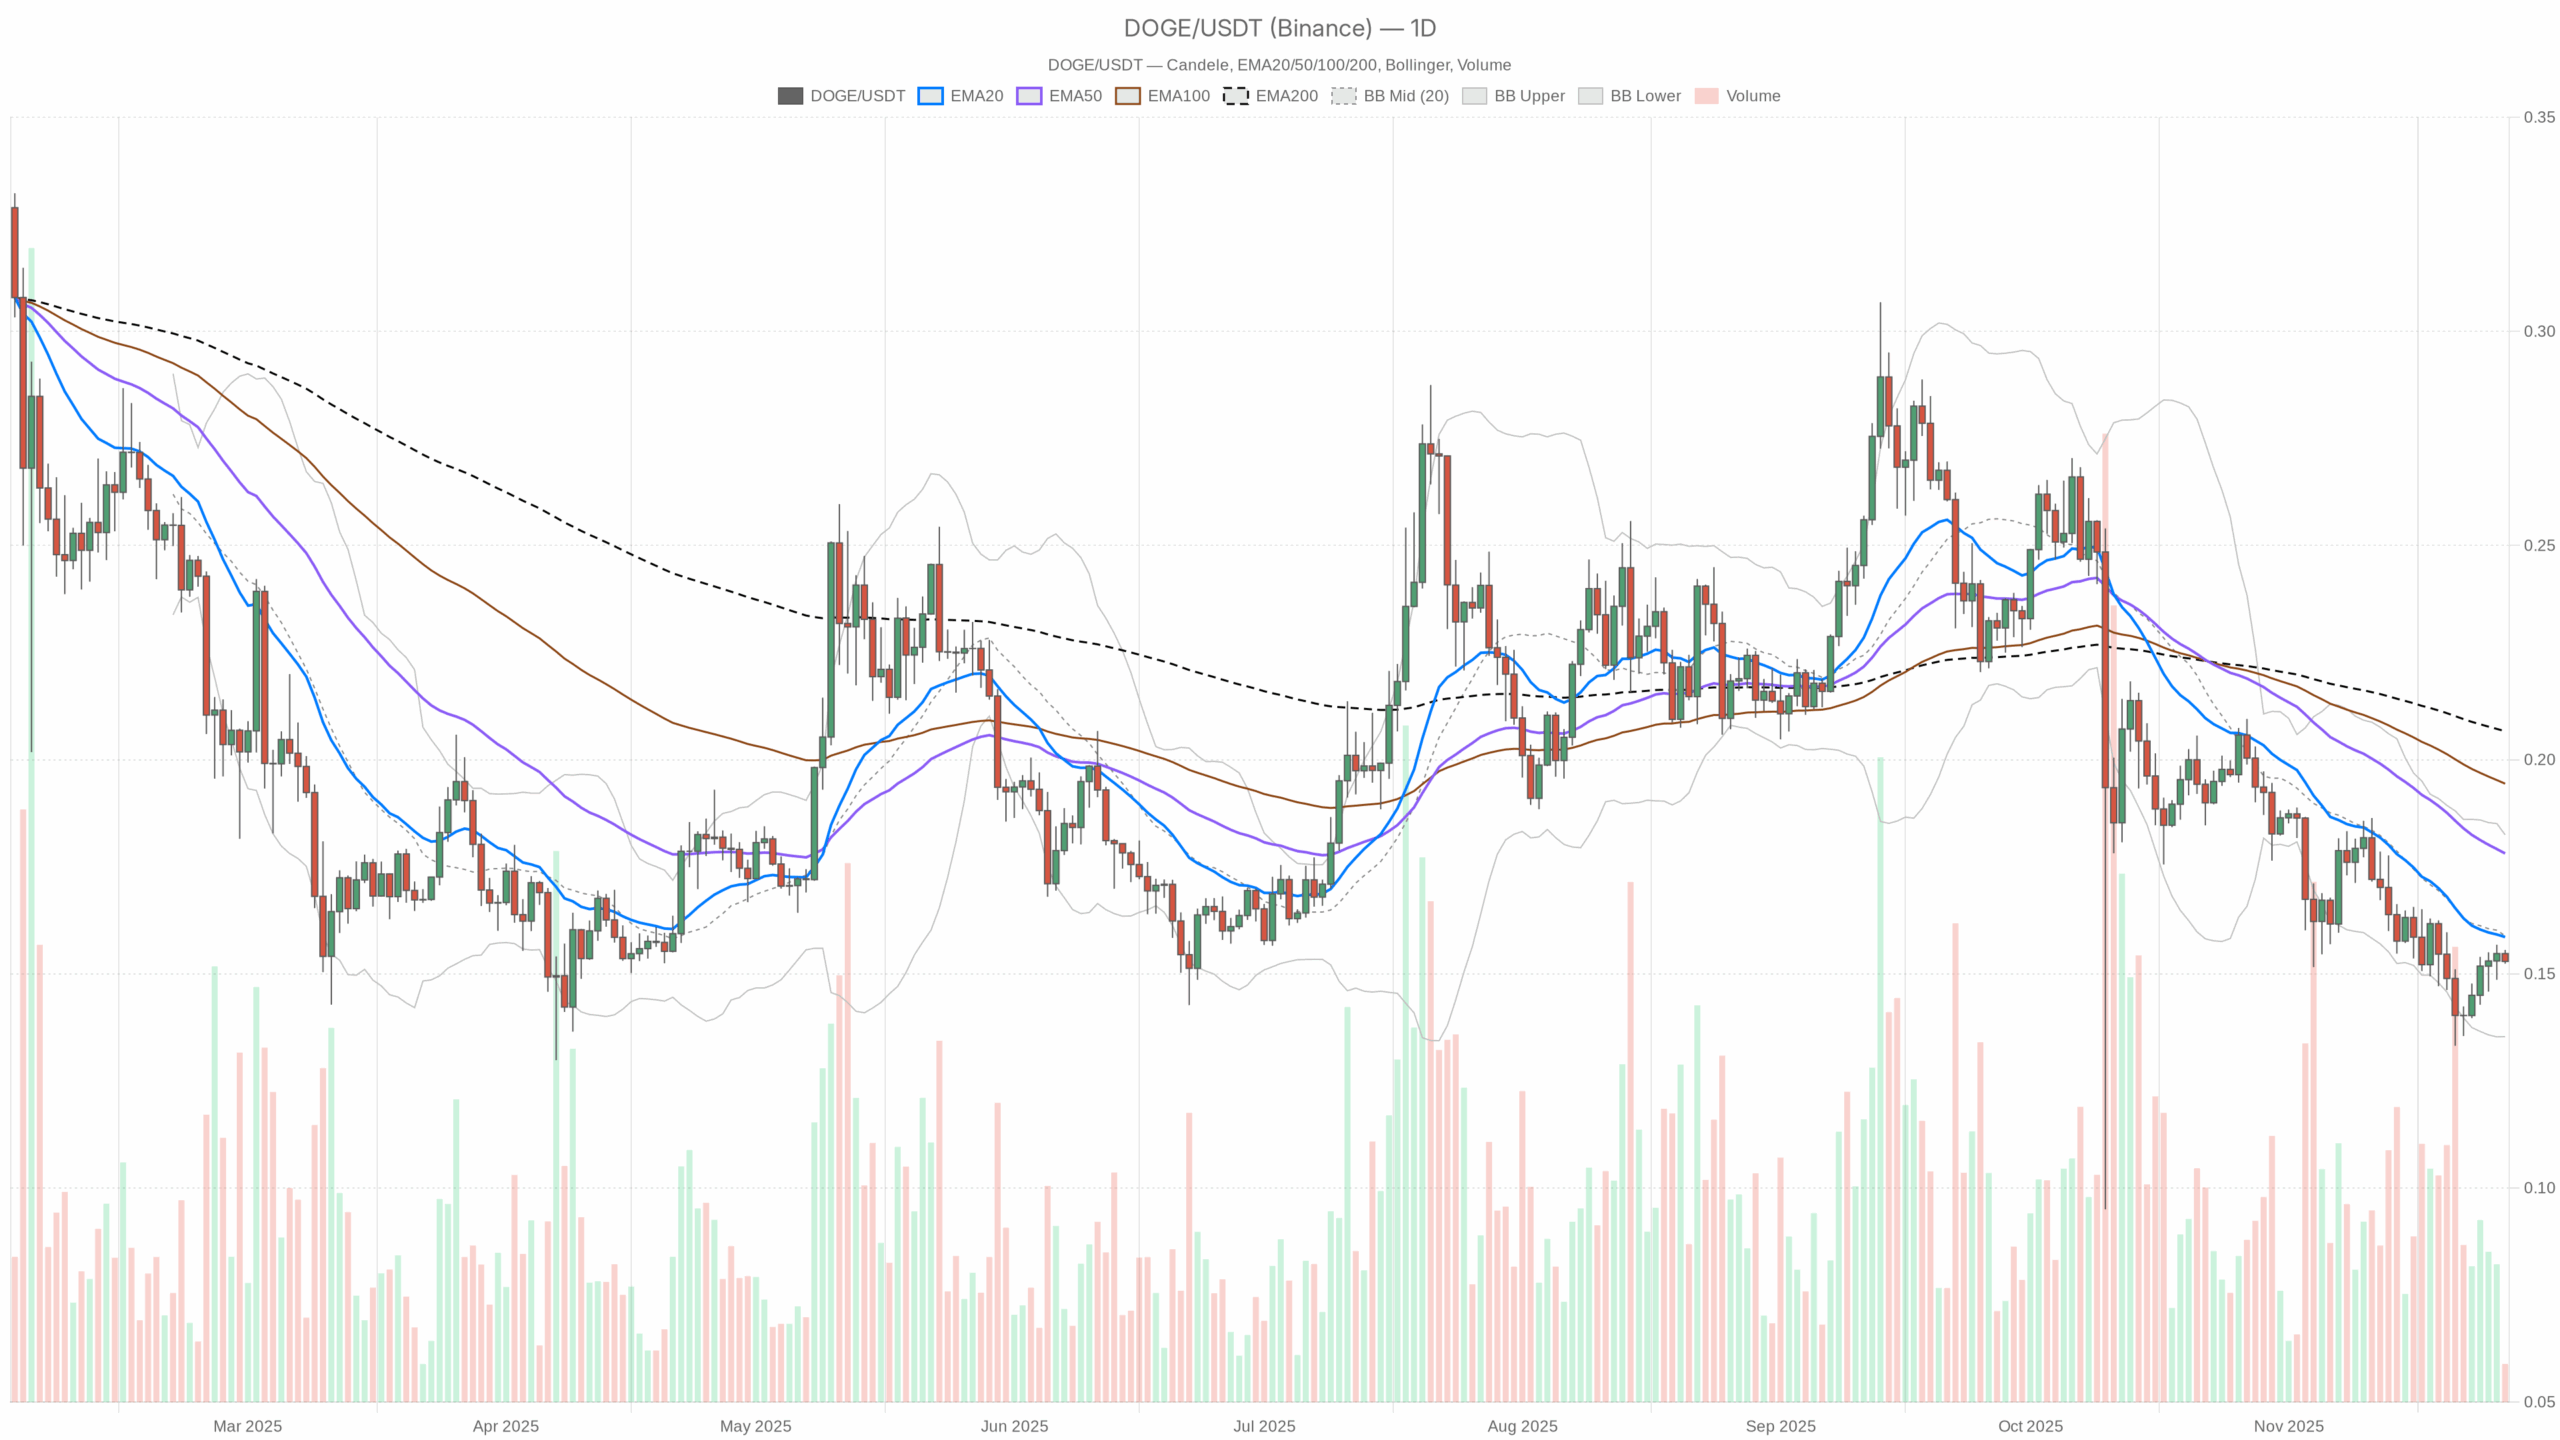 DOGE/USDT — daily chart with candlesticks, EMA20/EMA50 and volume.
Summary
On the daily chart, the asset trades near 0.15 USDT, below all its major moving averages, which signals a dominant bearish regime. Momentum indicators lean soft but not capitulatory, hinting at fatigue rather than panic selling. Moreover, volatility is contained, with the daily ATR close to 0.01, suggesting a consolidation phase after prior downside. Intraday timeframes show a flatter structure, indicating that short-term traders are probing for direction rather than extending the selloff. Meanwhile, Bitcoin dominance around 57% confirms a market still focused on majors, leaving memecoins on the defensive. Overall, sentiment across crypto is fragile, as the Fear & Greed Index sits in Extreme Fear territory, keeping risk appetite muted.
Dogecoin price: Market Context and Direction
Zooming out, the broader market remains sizeable, with total capitalization above 3.19 trillion dollars and up about 3.9% over the last 24 hours. Despite that bounce, Bitcoin controls roughly 57% of the market, reinforcing a risk-off market regime where capital prefers large caps. In such phases, speculative assets like this one often underperform or lag any recovery.
Sentiment data echo this caution: the Fear & Greed Index shows a value of 22, classified as Extreme Fear. This backdrop typically coincides with underleveraged conditions and hesitant dip-buying. However, it can also create the foundations for future contrarian opportunities, as excessive pessimism often compresses expectations. That said, with the daily trend still labeled bearish by the system’s regime filter, the main scenario for now remains downside-biased or, at best, sideways with a heavy tone.
Technical Outlook: reading the overall setup
The daily trend structure is clearly soft. Price at 0.15 sits below the 20‑day exponential moving average around 0.16, the 50‑day near 0.18, and the 200‑day close to 0.21. This full stack of EMAs above spot levels is classic evidence of trend confirmation to the downside. It means that rallies into these averages are likely to encounter supply until the structure meaningfully changes.
The 14‑day RSI stands near 42, slightly below the midpoint but not yet oversold. This suggests waning downside momentum without a full washout. Sellers are still in control, but the move is not stretched enough to force an immediate technical rebound. This fits with the MACD, where both line and signal sit at about -0.01, with a flat histogram. In practice, that configuration signals momentum exhaustion rather than an active new bearish impulse, often preceding consolidation ranges.
Bollinger Bands on the daily chart center around 0.16, with the upper band near 0.18 and the lower one close to 0.14. Price around 0.15 lies under the middle band but comfortably above the lower one, indicating a soft bearish bias within a contained volatility envelope. There is no sign of a large volatility spike yet. ATR around 0.01 reinforces this assessment: recent daily candle ranges are modest, consistent with cooling volatility after earlier selling pressure. Together, these readings portray a market that has stepped away from acute stress and moved into a watchful, low‑energy phase.
Intraday Perspective and DOGEUSDT token Momentum
On the hourly timeframe, the token trades at 0.15, almost glued to the 20, 50, and 200‑period EMAs, all clustered at the same price. This tight alignment points to a short-term equilibrium between buyers and sellers. The hourly RSI around 47 sits very close to neutral, while MACD is flat at zero, confirming the lack of a clear intraday trend.
Meanwhile, the 15‑minute view tells a similar story. Price is again pinned to the short, medium, and long EMAs at 0.15, with RSI dipping a bit lower around 39. This shows slightly bearish intraday momentum without trend acceleration. Bollinger Bands and ATR on both intraday timeframes are very narrow, which implies compressed volatility. As a result, any breakout from this tight range could travel faster than usual once a catalyst appears, even if the direction is not yet predetermined.
Key Levels and Market Reactions
Pivots across daily, hourly, and 15‑minute charts converge tightly around 0.15, with support and resistance clusters sitting essentially at the same level. This unusual compression around a single zone highlights 0.15 as a critical battleground for the next directional move. If price holds above this equilibrium area and begins closing back over the daily midpoint of the Bollinger Bands near 0.16, it would signal that buyers are slowly regaining initiative.
Conversely, a sustained break below the lower band region around 0.14, especially accompanied by an uptick in ATR, would indicate a fresh volatility expansion to the downside. In that case, intraday traders would likely pivot to selling any rebound into 0.15–0.16, using that area as a new resistance ceiling. Until such a move materializes, the market seems content to oscillate in a narrow corridor, with liquidity building around the pivot.
Future Scenarios and Investment Outlook
Overall, the current setup favors a cautious stance. The daily regime is bearish, EMAs lean clearly downward, and key oscillators show only tentative stabilization rather than a confirmed reversal. For swing traders, this argues for respecting the prevailing downtrend, looking for clearer trend reversal signals before adopting a more optimistic stance.
More speculative participants may watch for a volatility breakout from the 0.14–0.16 range. A decisive move back above the shorter EMAs with improving RSI and positive MACD would strengthen the case for a more constructive phase. Until then, position sizing and risk management remain essential, as sentiment across the crypto complex is still fragile despite the enormous market capitalization backdrop.
This analysis is for informational purposes only and does not constitute financial advice.
Readers should conduct their own research before making investment decisions.
You May Also Like

XRP Price Prediction: XRP Trapped At $1.37 As Breakout Setup Tightens

Why Digital Banks Are Growing 3x Faster Than Traditional Banks

