Zcash privacy coin outlook: ZECUSDT at a crossroads
 The Zcash privacy coin is trading in a delicate balance zone, where neither bulls nor bears fully control the daily trend. In this environment, traders are trying to understand whether the current pause is a simple breather within a broader advance or the early stage of a deeper corrective phase. Moreover, with sentiment across crypto swinging between fear and brief relief rallies, the next move in this pair will likely depend on how price behaves around a few critical technical zones.
 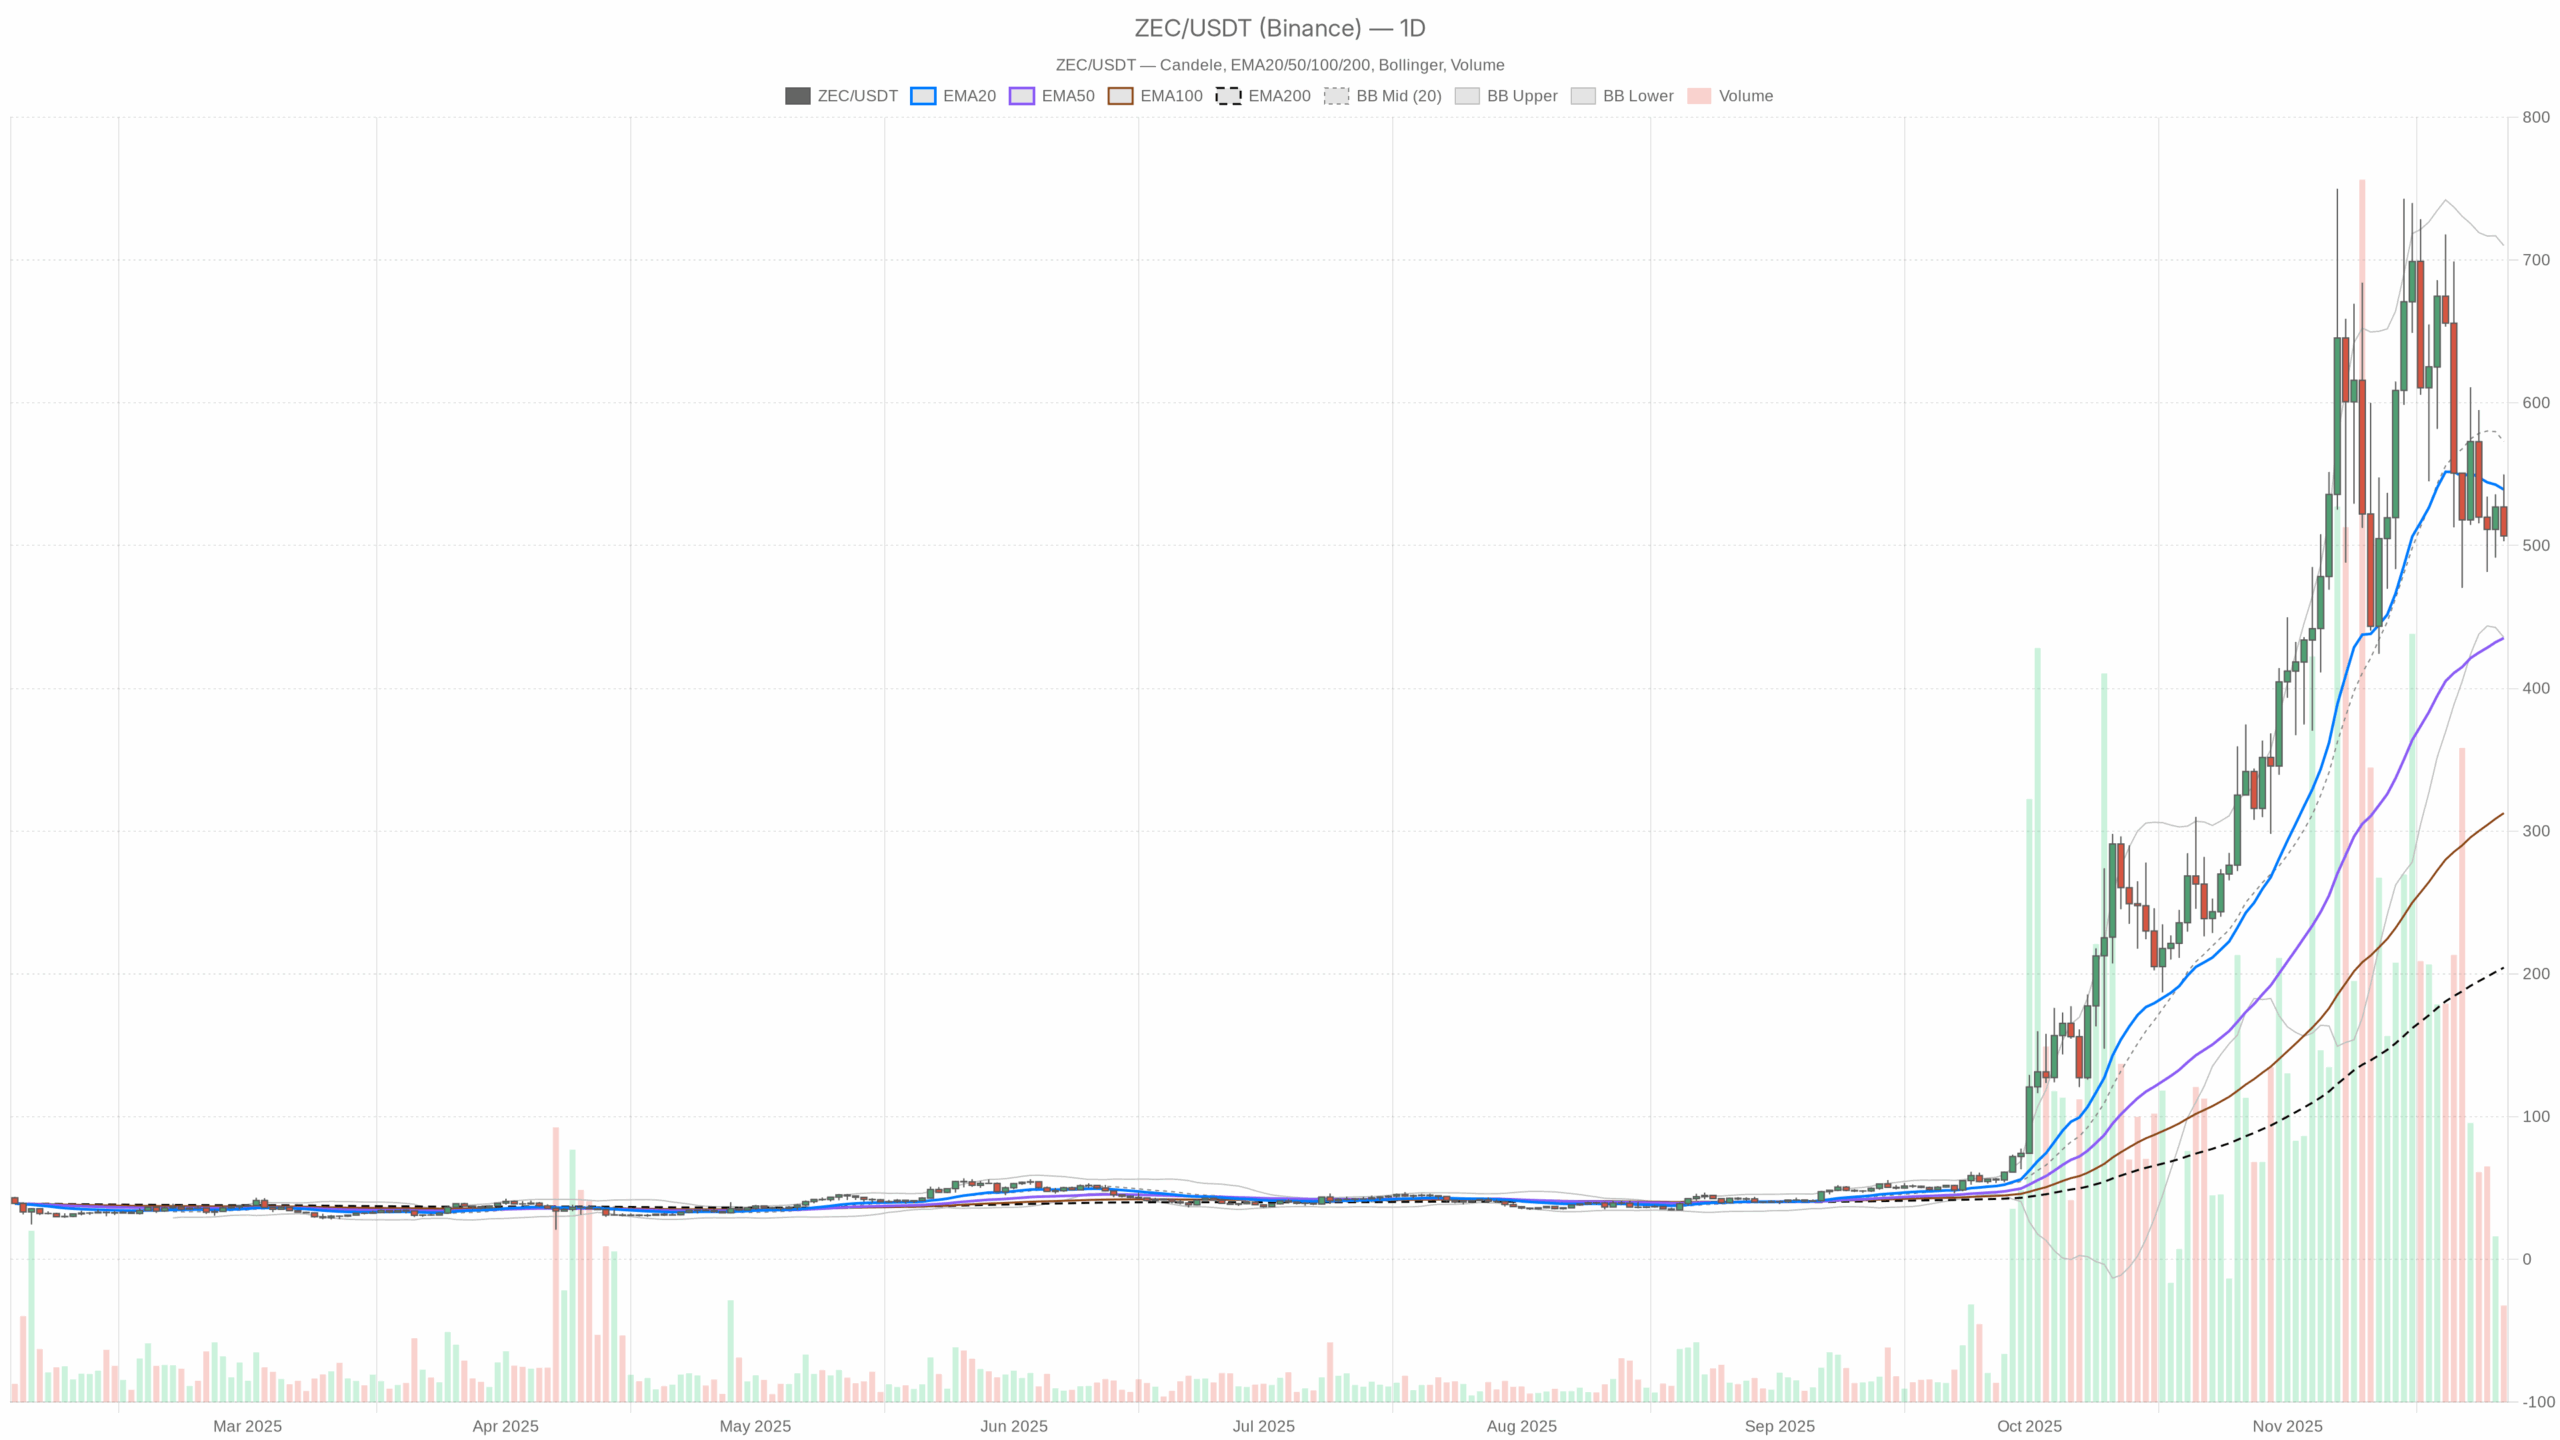 ZEC/USDT — daily chart with candlesticks, EMA20/EMA50 and volume.
Summary
On the daily chart, the asset sits in a neutral market regime, with price below the short-term moving average but still comfortably above the long-term one. Momentum indicators show a loss of upside strength but not an outright collapse, pointing to consolidation rather than panic. Volatility remains significant, with the average true range near 100 units, so swings around key levels can be sharp. Meanwhile, the broader crypto market is recovering, with total capitalization up strongly over the last 24 hours. However, high Bitcoin dominance above 57% suggests capital is still more focused on majors than niche tokens. Overall, investors appear cautious and selective, with the extreme fear reading in sentiment data confirming a defensive stance.
Zcash privacy coin: Market Context and Direction
The backdrop for this pair is shaped by a crypto market worth roughly 3.2 trillion dollars, after a solid one-day gain of nearly 4%. Moreover, Bitcoin’s dominance at around 57% indicates that large flows are gravitating toward the benchmark asset, leaving less room for aggressive speculative rotations into privacy-focused names. That said, periods of strong dominance often precede phases when traders start hunting for higher beta opportunities, which can eventually favor more peripheral assets.
The sentiment side is more fragile. The Fear & Greed Index sits in Extreme Fear territory at 22, signaling that many market participants remain risk-averse and quick to sell into strength. In contrast, such depressed sentiment historically creates the conditions for oversold bounces and mean-reversion rallies, especially when price action stabilizes above long-term averages. Therefore, the current context suggests a cautious but potentially constructive backdrop if selling pressure continues to fade.
Technical Outlook: reading the overall setup
On the daily timeframe, the asset closes near 506.8, sitting below the 20-day exponential moving average at about 539.3 but still above the 50-day EMA around 435.2 and far above the 200-day EMA near 204.4. This configuration points to a market where the long-term uptrend remains intact, yet short-term buyers have recently lost control. If price can reclaim the 20-day average, that would hint at trend confirmation to the upside; failure to do so would keep the tone corrective.
The daily RSI at roughly 49 reflects a market in equilibrium: neither overbought nor oversold. However, its slight drift below the midpoint underlines that upside momentum has cooled, favoring a consolidation phase in which dips may be bought but rallies could face quick profit taking. This balance can last for some time, especially when macro sentiment is cautious.
The MACD on the daily chart reinforces this picture. The main line, around 28.5, has slipped under its signal line at 52.6, generating a negative histogram near -24.1. This setup hints at momentum exhaustion after a prior advance, not yet a confirmed bearish trend. As long as the histogram does not deepen significantly, the signal leans toward digestion of previous gains rather than a structural breakdown.
Bollinger Bands add another layer. The price now trades below the mid-band near 572.9 but well above the lower band around 435.7. This suggests a pullback within the band structure, where sellers have the short-term edge but without signs of a full volatility-driven breakdown. Should price slide toward the lower band while RSI holds above oversold territory, it could set up a potential mean-reversion rebound.
Daily ATR around 96.8 confirms elevated volatility. Such conditions favor active traders who can manage risk tightly, as volatility expansion around support or resistance might trigger sharp directional moves. Swing investors, meanwhile, may prefer to wait for clearer confirmation that this volatility resolves either back into the prevailing longer-term trend or into a deeper correction.
Intraday Perspective and ZECUSDT token Momentum
On the hourly chart, the story turns more cautious. Price around 506.8 sits below the 20, 50, and 200-period EMAs, clustered between roughly 514.6 and 558.8. This alignment signals a short-term bearish regime, with intraday rallies repeatedly capped near these descending averages. Meanwhile, the hourly RSI near 43.6 confirms that sellers retain the advantage, though conditions are not extremely oversold.
The hourly MACD supports this intraday pressure: the line sits below the signal, with a negative histogram, indicating persistent but not explosive downside momentum. As a result, short-term traders may continue to fade bounces toward the hourly EMAs until the indicator flattens or crosses back up, signaling momentum rebalancing.
On the 15-minute chart, the picture is similar. Price hovers just under the short EMAs and slightly beneath the mid Bollinger Band, with an RSI near 40. This configuration points to a controlled intraday downtrend rather than capitulation. If lower timeframes begin carving higher lows while MACD stabilizes, it could foreshadow an attempt to retest hourly resistance areas.
Key Levels and Market Reactions
On the daily scale, the central pivot sits near 519.9. Trading just below this reference level shows a market testing a balance point between bulls and bears. The first resistance zone emerges around 536.8, close to the short-term EMA, where sellers are likely to defend and where a clean break would signal a potential bullish breakout attempt. Above that, the middle Bollinger Band near 573 becomes the next important test for trend recovery.
On the downside, initial support appears around 489.9, the first pivot support. A sustained move below this area would open the door to a deeper test toward the lower daily band near 435.7, where buyers might try to reassert the broader uptrend. Intraday, the hourly pivot close to 509.2 and its nearby support at 503.6 are immediate reference levels; swift reactions there can confirm whether short-term traders are willing to accumulate on dips or still prefer selling into every rebound.
Future Scenarios and Investment Outlook
Overall, the main scenario on the daily timeframe remains neutral with a constructive long-term bias, as price trades well above the 200-day average but struggles with shorter EMAs. If the pair regains the 540 area and consolidates above it, the balance would tilt toward bullish continuation, supported by the long-term trend. Conversely, repeated failures below the 520 pivot followed by a break under 490 would favor a deeper corrective phase, especially while sentiment stays in extreme fear.
For investors, this means positioning size and risk management are more important than outright direction calls. Longer-term participants may see volatility and fear as an opportunity to accumulate gradually while the structure holds above key long-term supports. Shorter-term traders, meanwhile, can focus on the intraday bearish bias, selling into rallies until momentum indicators signal that selling pressure has clearly exhausted.
This analysis is for informational purposes only and does not constitute financial advice.
Readers should conduct their own research before making investment decisions.
You May Also Like

Tokyo’s Metaplanet Launches Miami Subsidiary to Amplify Bitcoin Income

US and UK Set to Seal Landmark Crypto Cooperation Deal