Ethereum MVRZ-score reaches 0.29, which indicates accumulation area. BlackRock dominates inflows of 78.6M ETF. Technical trends are indicative of a possible breakout of 9K. Ether has good accumulation patterns based on several indicators. The MVRV Z-Score has declined to 0.29. This is the point at which investors have a history of ideal entry. Ali Charts […] The post Ethereum News: Ethereum’s MVRV Z-Score Flashes Buy Signal as ETFs Surge appeared first on Live Bitcoin News.Ethereum MVRZ-score reaches 0.29, which indicates accumulation area. BlackRock dominates inflows of 78.6M ETF. Technical trends are indicative of a possible breakout of 9K. Ether has good accumulation patterns based on several indicators. The MVRV Z-Score has declined to 0.29. This is the point at which investors have a history of ideal entry. Ali Charts […] The post Ethereum News: Ethereum’s MVRV Z-Score Flashes Buy Signal as ETFs Surge appeared first on Live Bitcoin News.

Ethereum News: Ethereum’s MVRV Z-Score Flashes Buy Signal as ETFs Surge

2025/11/27 11:30

Ethereum MVRZ-score reaches 0.29, which indicates accumulation area. BlackRock dominates inflows of 78.6M ETF. Technical trends are indicative of a possible breakout of 9K.

Ether has good accumulation patterns based on several indicators. The MVRV Z-Score has declined to 0.29. This is the point at which investors have a history of ideal entry.

Ali Charts on X indicate that Ethereum accumulation has been best at times when the MVRV Z-Score is negative. The indicator is at 0.29, which is an indication that the asset is in attractive territory. This measure has been effective in determining places of accumulation since 2016.

Ethereum News: Ethereum's MVRV Z-Score Flashes Buy Signal as ETFs Surge

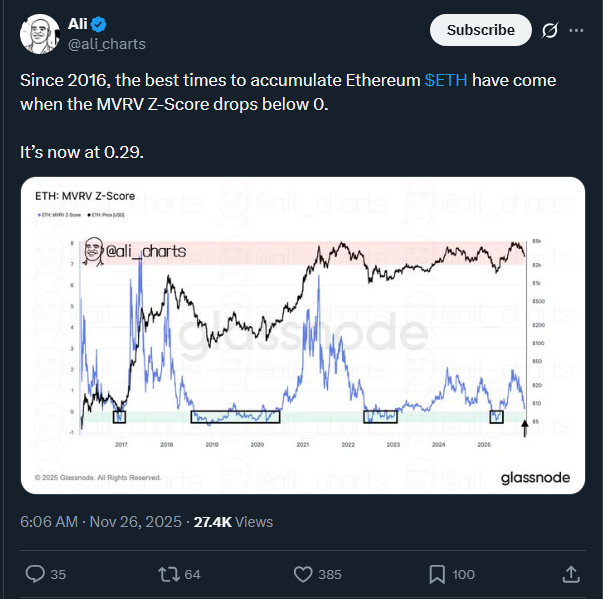
Source – Ali Charts X

BlackRock Dominates Record ETF Inflows

There is an upward trend in institutional demand for Ethereum. Yesterday, ETF inflows totalled $ 78.6 million. BlackRock was the first to make the purchases totaling $46.1 million.

Ethereum News: Ethereum's MVRV Z-Score Flashes Buy Signal as ETFs Surge

Source – X Ted Pillows

Ted Pillows posted these numbers on X. The information underscores increasing institutional interest in Ethereum exposure. The huge hold of BlackRock shows their belief in the future prospects of the asset.

Such inflows are a drastic change in institutional behavior. Ethereum is seeing increased investments by traditional finance players. The trend indicates mainstream adoption is picking up.

You might also like: Ethereum News: Ethereum’s Powerful Bullish Reversal: 3 Elliott Wave Signals Defying Market Fear

Years of Consolidation Point to Explosive Move

Since 2021, Ethereum has been in consolidation. CryptoAnup wrote on X that the asset is stuck in a huge accumulation range. Prices have been rejected by the macro trendline on numerous occasions.

Ethereum News: Ethereum's MVRV Z-Score Flashes Buy Signal as ETFs Surge

Source –  CryptoAnup X 

The coiling pattern may be extended, resulting in explosive motion. Technical analysis suggests a possible target of between $8.5K and $9K. This is an estimate of the present price behavior and structural trends.

The consolidation over the years has created a lot of energy. The move might be important once the breakout takes place. Historical trends indicate that there are long accumulation durations before significant rallies.

Bullish is supported by the market structure. Ether has been building a foundation for years. The technical layout, together with institutional inflows, leads to good conditions.

The post Ethereum News: Ethereum’s MVRV Z-Score Flashes Buy Signal as ETFs Surge appeared first on Live Bitcoin News.

Disclaimer: The articles reposted on this site are sourced from public platforms and are provided for informational purposes only. They do not necessarily reflect the views of MEXC. All rights remain with the original authors. If you believe any content infringes on third-party rights, please contact service@support.mexc.com for removal. MEXC makes no guarantees regarding the accuracy, completeness, or timeliness of the content and is not responsible for any actions taken based on the information provided. The content does not constitute financial, legal, or other professional advice, nor should it be considered a recommendation or endorsement by MEXC.

You May Also Like

Can Bulls Defend the $2 Mark?

Can Bulls Defend the $2 Mark?

The post Can Bulls Defend the $2 Mark? appeared on BitcoinEthereumNews.com. The crypto market is holding its breath as the Federal Reserve is widely expected to announce another rate cut next week. With an 86% probability of a 25-basis-point reduction, the move signals a shift in monetary policy—one that could ripple through traditional and digital markets alike. For XRP price, this decision comes at a critical juncture. The token is consolidating near the $2 mark, showing early signs of compression that could lead to a decisive breakout or breakdown. How the Fed’s Decision Could Influence XRP Price Prediction When the Fed lowers interest rates, liquidity usually flows toward higher-risk assets like cryptocurrencies. Investors see reduced borrowing costs as a green light to move capital away from bonds and into speculative sectors. In the short term, this could boost demand across the crypto market, especially for large-cap coins like XRP that have historically tracked broad market sentiment. However, this policy shift isn’t without risk. If the rate cut sparks fears of inflation, the dollar might weaken temporarily, boosting crypto prices, but an overheated market could later face correction once inflation pressures resurface. In essence, XRP’s near-term rally potential depends not only on the cut itself but on how investors interpret the Fed’s broader tone—whether it signals a short-term stimulus or a sustained dovish stance. Technical Analysis: XRP Price Faces a Tight Squeeze XRP/USD Daily chart- TradingView The XRP price daily chart shows price holding just above the $2.04 zone, hugging the lower Bollinger Band range. The bands have tightened, signaling a phase of volatility contraction. Historically, such setups precede large directional moves. The middle band (SMA 20) around $2.11 acts as immediate resistance, while the upper band near $2.28 defines the ceiling for bullish expansion. The Heikin Ashi candles show mild indecision—smaller bodies and wicks on both sides—hinting at market hesitation. A…
Share
BitcoinEthereumNews2025/12/07 13:43