

Analysts Call Solana Price Reversal: SOL USD Shoots High For $160
SOL moved higher on Tuesday as traders spotted early signs of a trend shift, pushing the token back toward a key resistance area.
Solana traded near $136 across major exchanges after bouncing off a well-watched support level.
Analysts said the move appears to be a short-term reversal, aided by steady activity in the derivatives market.
The market spent most of November under pressure, and SOL followed suit. But positioning is now picking up again.
DISCOVER: Top Solana Meme Coins to Buy in 2025
Does Rising DEX and Perp Volume Signal Growing Confidence in Solana?
Coinglass data shows that futures open interest is approximately $ 7.0 billion, and 24-hour futures volume is around $ 19 billion. Spot trading also surpassed $ 1 billion in daily turnover.
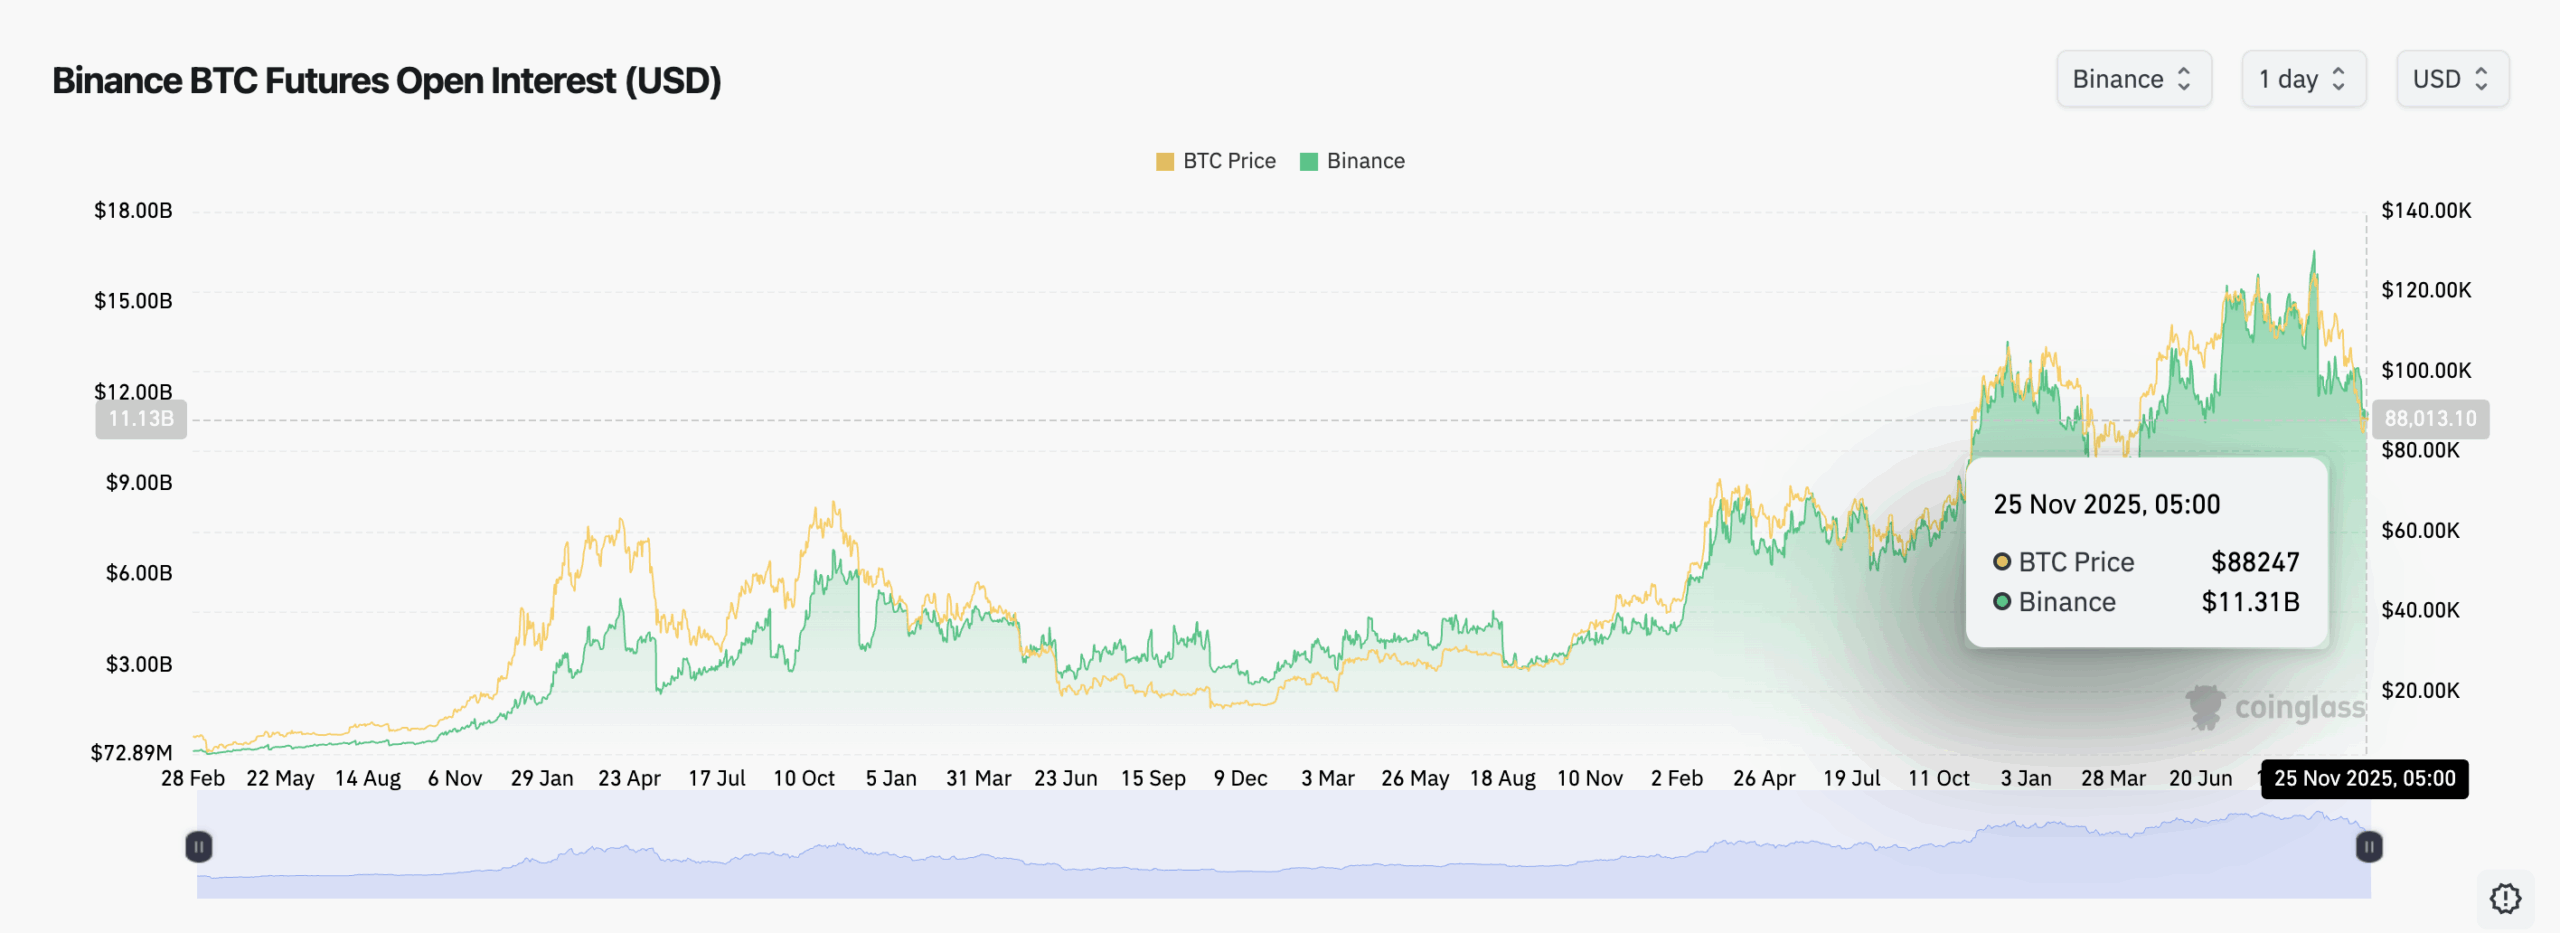 (Source: Coinglass)
These numbers indicate that traders are stepping back in after several days of slow, choppy trading.
And with SOL reclaiming the mid-$130 range, attention now turns to whether it can push toward the next resistance zone.
DeFiLlama data shows that the network’s total value locked is approximately $ 8.878 billion, indicating that liquidity across major protocols hasn’t faded.
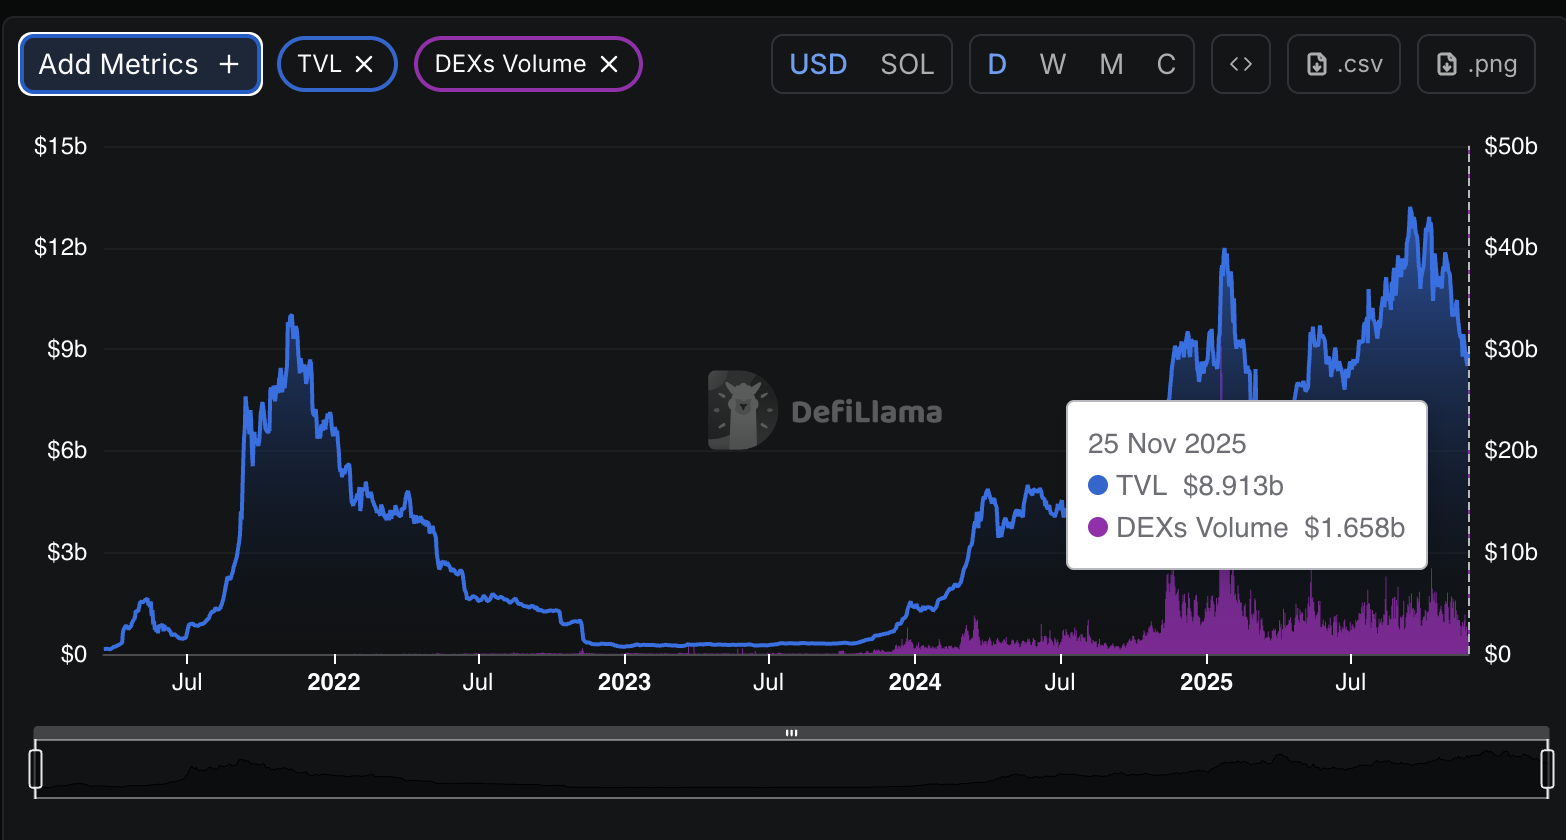 (Source: DefiLlama)
Solana’s 24-hour DEX volume sits near $1.795Bn, and perpetual futures are close behind at $1.869Bn. Together, these figures show steady use of Solana’s spot and derivatives markets.
DISCOVER: 9+ Best High-Risk, High-Reward Crypto to Buy in 2025
Solana Price Prediction: How Far Can SOL Climb If It Clears the $155 Resistance?
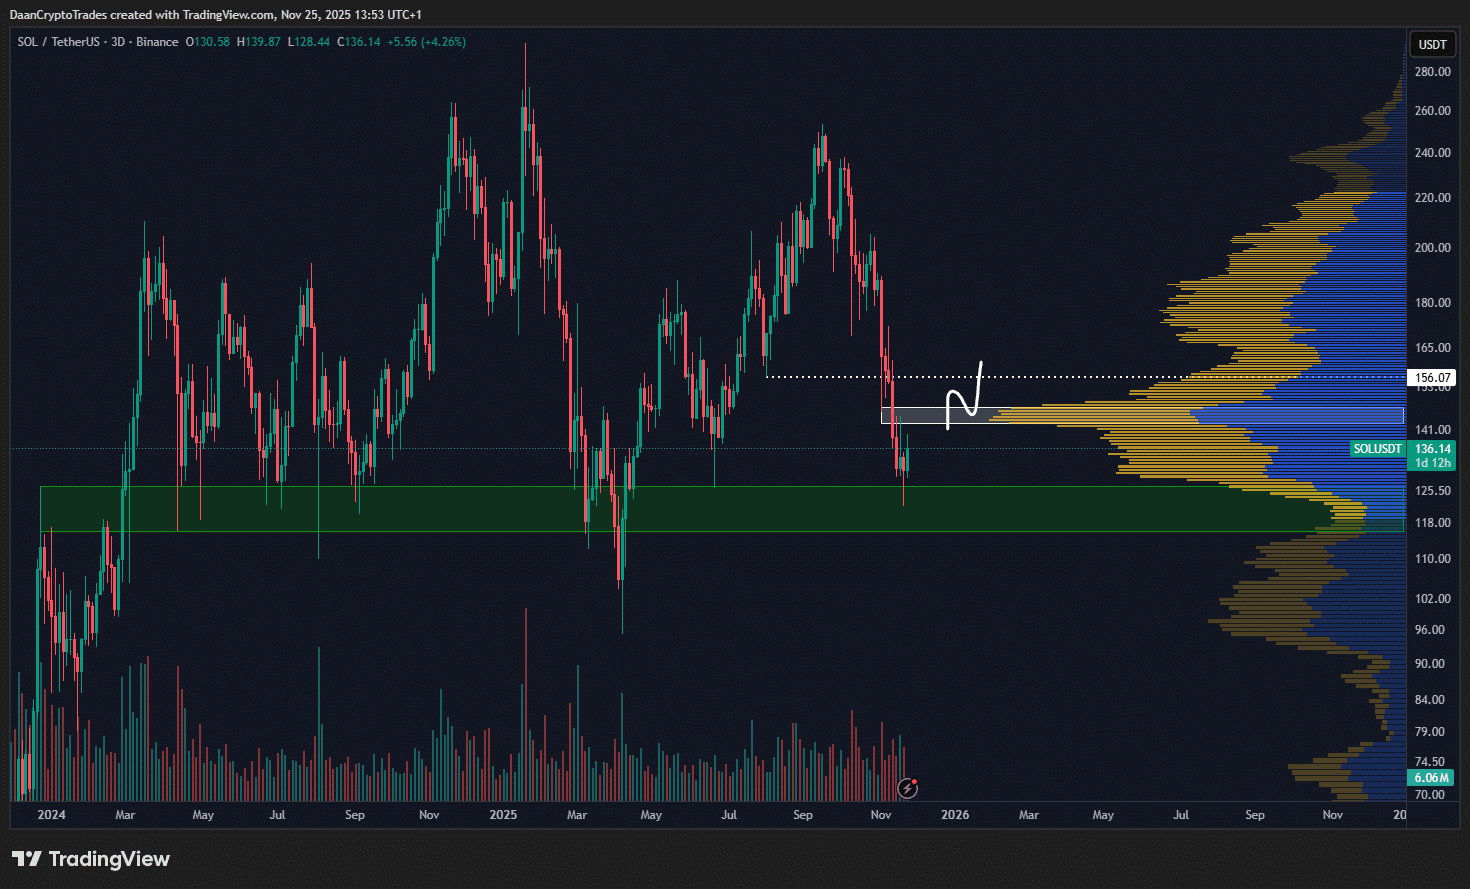
The network is also trying to find its footing after a long stretch of selling. Analyst Daan Crypto shared a chart outlining the levels traders are watching. He said, “SOL has been in a big slump. But with the first signs of life from some SOL memes, and SOL sitting at high timeframe support, it got my attention.”
His chart shows Solana pressing against a key support area that has held multiple times in the past. And while momentum has slowed, the ongoing activity across DEXs and perps suggests traders haven’t stepped back.
On the 3-day chart, SOL has slipped into a broad high-time-frame demand zone between $118 and $130. This area triggered strong rebounds several times in 2024 and early 2025.
 (Source: X)
Price is now holding just above this green support block after a sharp wick down, indicating that buyers are stepping in to protect the level for now.
SOL was rejected from this zone during the latest pullback, but a clean move back above it would shift momentum and open the next leg higher.
Above $145, the next clear resistance sits near $155. This level lines up with another volume cluster and the dotted white line on Daan’s chart. He says that if SOL can close back above this zone, “the ~$155 area would be next.”
The broader trend remains weak, but the first signs of support are starting to emerge.
These small reactions don’t confirm a full shift yet, but they leave room for a possible rebound in the coming weeks.
DISCOVER: Next 1000X Crypto – Here’s 10+ Crypto Tokens That Can Hit 1000x This Year
The post Analysts Call Solana Price Reversal: SOL USD Shoots High For $160 appeared first on 99Bitcoins.
You May Also Like

XRP Price Prediction: XRP Trapped At $1.37 As Breakout Setup Tightens

Why Digital Banks Are Growing 3x Faster Than Traditional Banks

